Prices fall year-over-year in San Francisco Bay Area & New York condo market. Seattle below June 2018. Chicago nearly flat year-over-year. Other markets lose steam. Phoenix, Tampa, Charlotte surge.
By Wolf Richter for WOLF STREET.
Powered by the innumerable millionaires and multimillionaires that the mega IPOs would be suddenly printing in 2019, home prices in the San Francisco Bay Area would be doomed to surge this year, thus exacerbating the “housing crisis,” as it’s called locally, even further, the media have promised us incessantly earlier this year, having fallen once again for real estate industry hype. Now we got another data point that demolishes this myth.
San Francisco Bay Area House Prices
Prices of single-family houses in the five-county San Francisco Bay Area – the counties of San Francisco, San Mateo (northern part of Silicon Valley), Alameda and Contra Costa (East Bay), and Marin (North Bay) – fell 0.4% in October from September and were down 0.4% from the same month a year ago, and were down 1.5% from the peak in June, according to the S&P CoreLogic Case-Shiller Home Price Index released on December 31. This put the index back where it had first been in May 2018. Note the double peak in 2018-2019, and note a similar double-peak in 2006-2008:
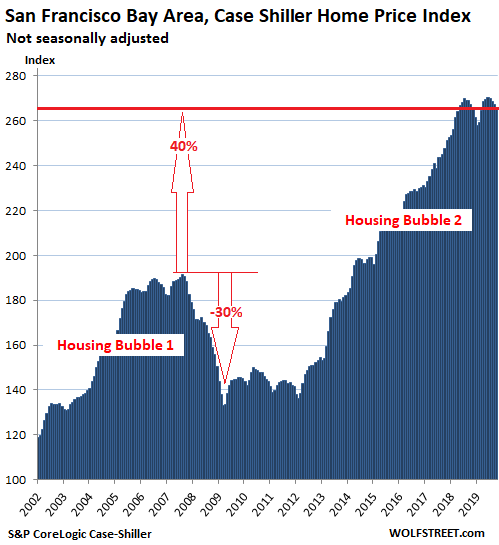
The Case-Shiller Index is a rolling three-month average. This release includes closings that were entered into public records in August, September, and October. The index was set at 100 for January 2000. San Francisco’s index value of 266 means prices in the metro have soared 166% since January 2000.
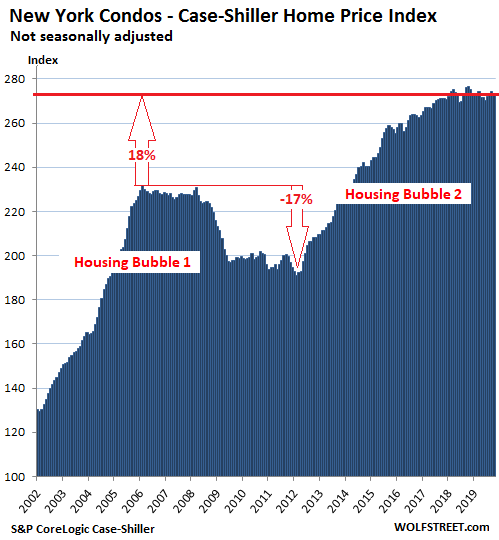
New York Condo Prices:
Condo prices in the vast New York City metro ticked down 0.3% in October from September and were down 1.3% from a year ago, and below where they’d first been in February 2018, and were up only 0.7% from October two years ago.
The Case-Shiller Index, which mostly uses standard Metropolitan Statistical Areas for its city indices, uses a custom area for New York City that includes numerous counties in the states of New York, New Jersey, and Connecticut “with significant populations that commonly commute to New York City for employment purposes.”
All charts in this series are on the same scale, with the vertical axis going from 100 to 290, which has the effect that there is more white space above the curve in markets where house prices have not soared as much as they have in Los Angeles, San Francisco, Seattle, or Miami. These charts show that there is no “national” housing market and no “national” housing bubble, and that all markets are local, with different dynamics, price levels, and price changes, and that the bubbles, where they exist, are local too.
The Case-Shiller Index methodology is based on “sales pairs,” comparing the sales price of a house that sold in the current month to the price of the samehouse when it sold previously. This method avoids some of the problems other indices have, such as “median price” indices, which are skewed by “mix”; and “average price” indices, which are skewed by a few big outliers.
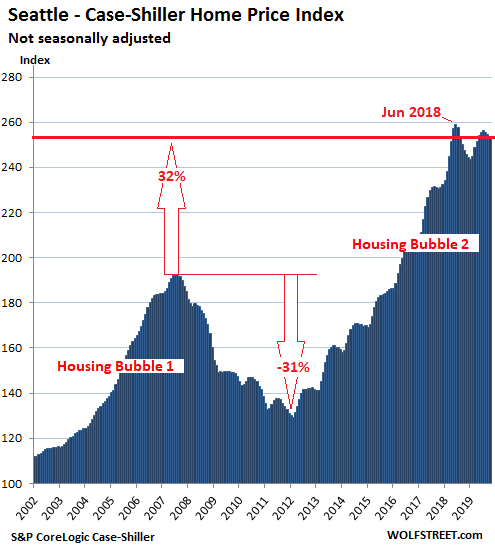
Seattle House Prices:
House prices in the Seattle metro declined 0.3% in October from September, and where down 2.0% from the peak in June 2018. This put them below where they’d first been in May 2018. In a testament to how steep the declines were last year from August through December, and that were followed by a bounce, the index in October 2019 was up 2.5% from a year ago. Note the double peak, with the lower high in June and July 2019:
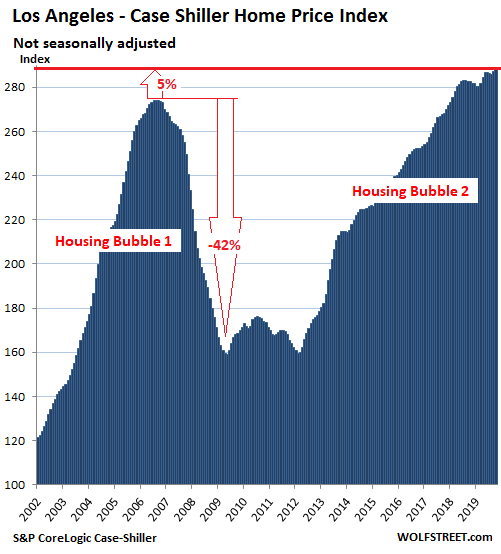
Los Angeles House Prices:
The Los Angeles metro is now the US market where house prices, according to the Case-Shiller Index, have risen the most since January 2000: With the index at 288, house prices are now 188% higher than they were in January 2000. In October, the index rose 0.4% from September and was up 2.0% year-over-year:
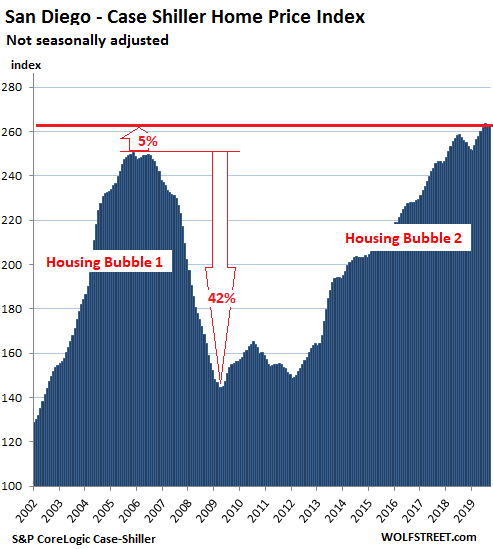
San Diego House Prices:
House prices in the San Diego metro edged down 0.2% in October from September and were essentially flat for the past five months. They’re up 2.9% year-over-year:
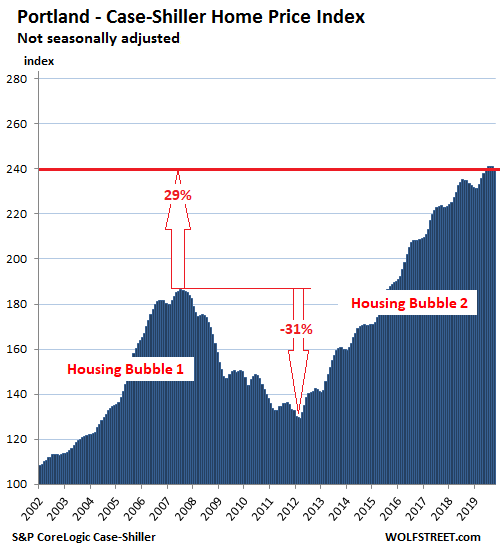
Portland House Prices:
House prices in the Portland metro fell 0.5% in October from September but were up 2.7% year-over-year. The index has been essentially flat for the past five months. At 240, the index is up 140% from January 2000:
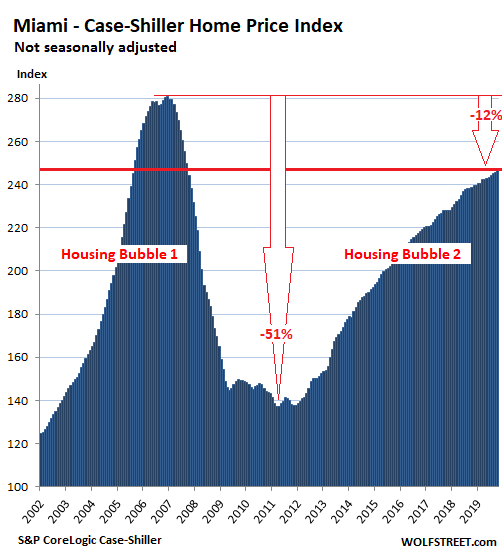
Miami House Prices:
The Case-Shiller index for the Miami metro rose 0.3% in October from September and 3.3% year-over-year, but remains down 12% from the most splendid craziness at the end of 2006:
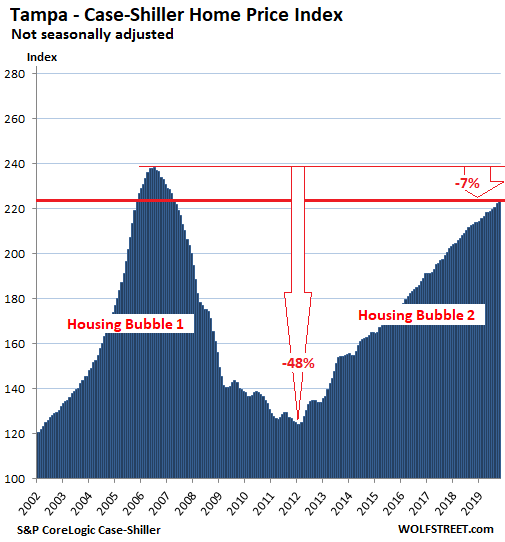
Tampa House Prices:
House prices in the Tampa metro rose 0.6% in October from September and were up 4.9% year-over-year, the second largest year-over-year increase of the metros in this series, behind Phoenix (+5.9%). The index is closing in on the craziness in 2006:
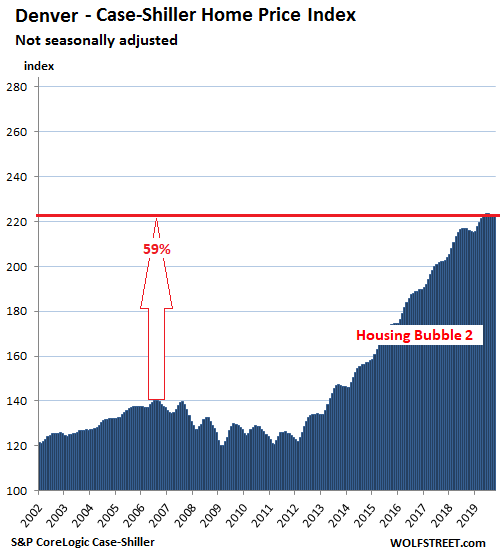
Denver House Prices:
House prices in the Denver metro remained essentially flat in October for the fifth month in a row (down a smidgen from June), but were up 3.0% year-over-year:
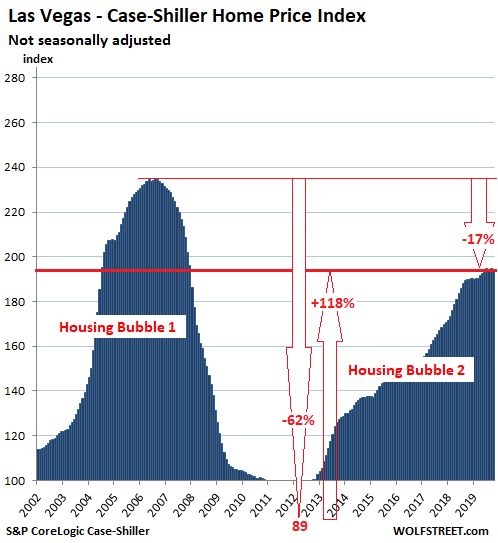
Las Vegas House Prices:
The Case-Shiller index for the Las Vegas metro ticked down in October from September and was roughly flat for the past four months. This whittled down the year-over-year gain to 2.3%, the smallest such gain since August 2012, when prices began to emerge from the collapse. House prices have skyrocketed 118% since March 2012:
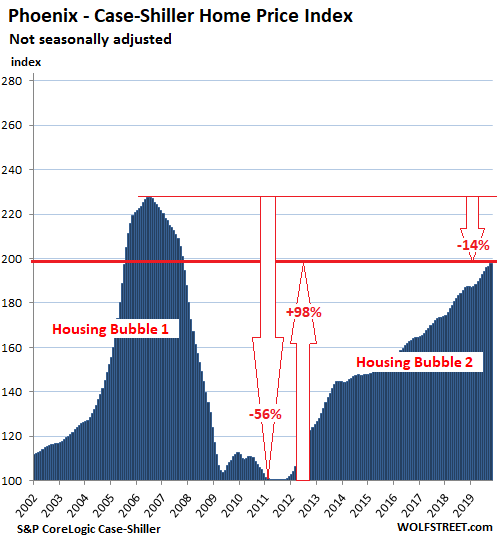
Phoenix House Prices:
House prices in the Phoenix metro rose 0.5% in October from September and were up 5.8% from October last year, the fastest year-over-year growth among the metros. And it’s closing in on the craziness of 2006. House price have nearly doubled in the eight years since September 2011:
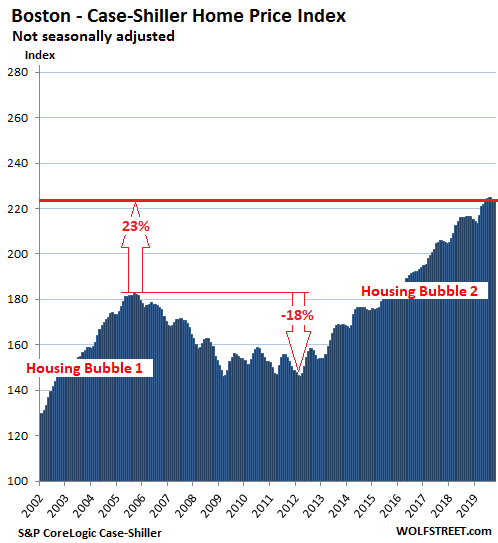
Boston House Prices:
House prices in the Boston metro were flat in October compared to September, and were down a tad from June, which trimmed their year-over-year gain to 3.4%:
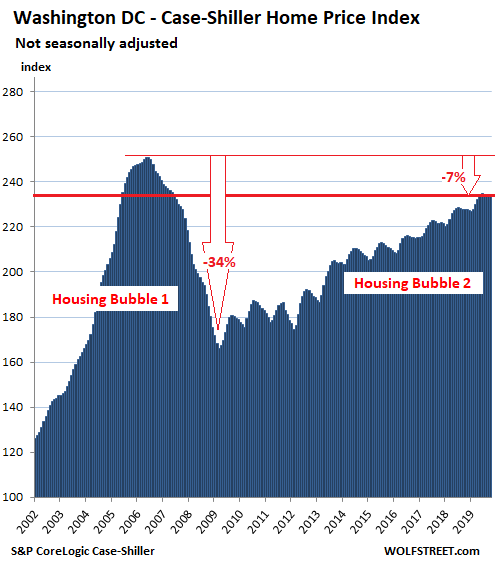
Washington DC:
House prices in the Washington D.C. metro ticked up 0.3% in October from September and were essentially flat for the past five months, but were up 3.0% year-over-year:
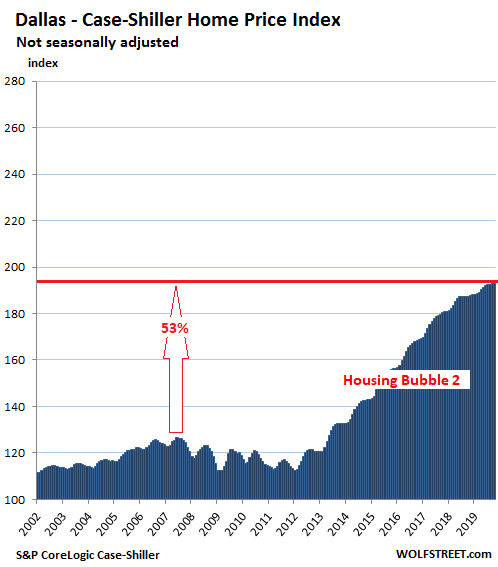
Dallas-Fort Worth House Prices:
In the Dallas-Fort Worth metro – counties of Collin, Dallas, Delta, Denton, Ellis, Hunt, Johnson, Kaufman, Parker, Rockwall, Tarrant, and Wise – house prices ticked down a smidgen in October from September, and have been about flat for the last four months. This whittled down the year-over-year gain to 2.9%:
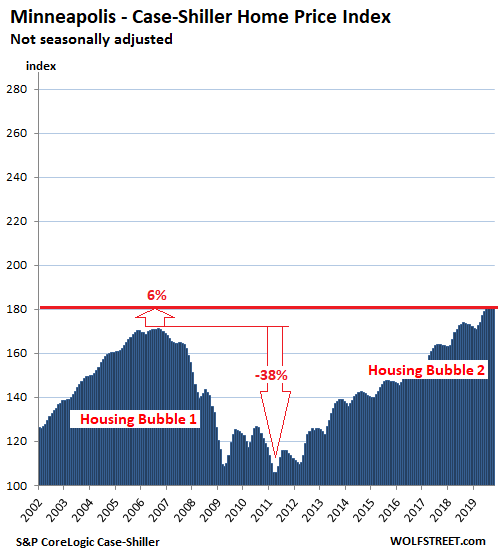
Minneapolis house prices:
In the Minneapolis metro, house prices dipped 0.2% in October from September and have been flat for the past four months. On a year-over-year basis, prices rose 4.2%:
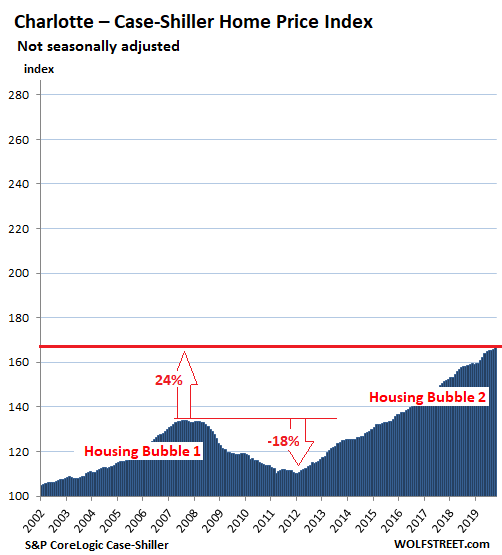
Charlotte house prices:
House prices in the Charlotte metro rose 0.4% in October from September, which increased their year-over-year gain to 4.8%, the third highest gain on this splendid list, behind Phoenix and Tampa:
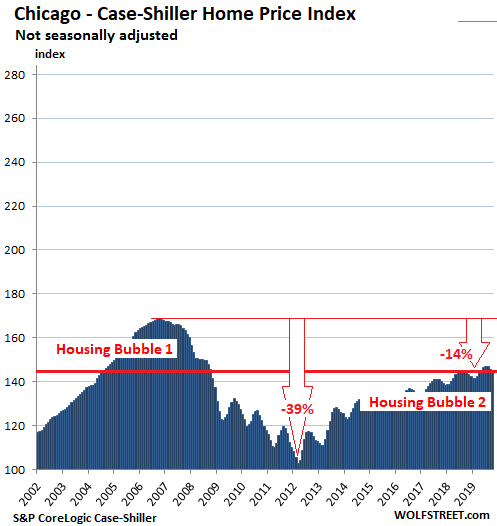
Chicago House Prices:
In the Chicago metro – the counties of Cook, DeKalb, Du Page, Grundy, Kane, Kendal, McHenry, and Will – house prices fell 0.4% in October from September, whittling down the year-over-year gain to just 0.5%:
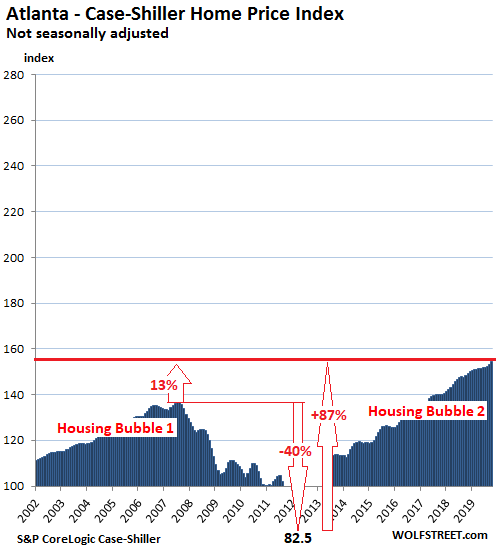
Atlanta house prices:
The Case-Shiller Index for the Atlanta metro jumped 0.7% in October from September and rose 4.1% year-over-year. Note that during Housing Bust 1, the index had plunged 40% to a value of 82.5 in March 2012, back where it had been in 1996, but in the 7.5 years since then, it has surged 87%, including at year-over-year rates ranging from 10% to 20% in all of 2013 and through mid-2014:
This is house price inflation.
The Case-Shiller Index, by comparing the sales price of a house in the current month to the price of the same house when it sold previously, tracks how many more dollars it takes to buy the same house over time, thus tracking the purchasing power of the dollar with regards to houses in various markets. This makes the index a measure of local “house-price inflation.” When the index shows that prices in Los Angeles shot up 188% in 19 years, despite the plunge in the middle, it doesn’t mean that houses have nearly tripled in size or opulence, but that in that metro, the dollar’s purchasing power with regards to houses has gotten crushed.