Wolf Richter wolfstreet.com, http://www.amazon.com/author/wolfrichter
San Francisco Bay Area House prices -4.3%, condos -5.7% since July, Seattle house prices -5.9%, most since Housing Bust 1; Los Angeles, San Diego, Denver, Portland, New York condos, even Boston decline. Dallas ticks up.
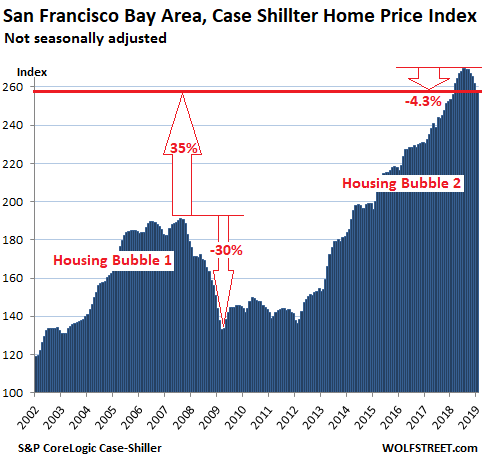
The most obvious one was Seattle. Now it’s joined by a second most obvious one, the San Francisco Bay Area. According to the CoreLogic Case-Shiller Home Price Index released this morning, single-family house prices in the five-county San Francisco Bay Area — the counties of San Francisco, San Mateo (northern part of Silicon Valley), Alameda, Contra Costa (both part of the East Bay ), and Marin (part of the North Bay) — fell 1.3% in January from December and are now down 4.3% from the peak last July, the biggest six-month drop since the six-month period ended in February 2012, the bottom of Housing Bust 1.
The San Francisco index is up just 1.8% from a year ago, despite the surge in prices early 2018, and remains 35% above the peak of Housing Bubble 1:
The Core-Logic Case-Shiller Home Price Index is a rolling three-month average; this morning’s release tracks closings that were entered into public records in November, December, and January.
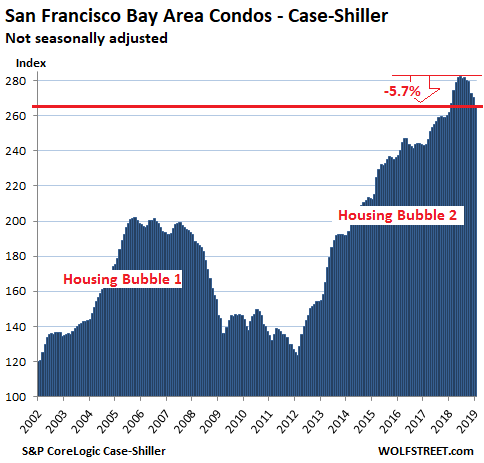
For the five-county San Francisco Bay Area, Case-Shiller also offers a separate index for condo prices, which fell 1.6% month-to-month to the lowest level since January 2018. Condo prices are now down 5.7% from their peak in June, the steepest seven-month decline since February 2012:
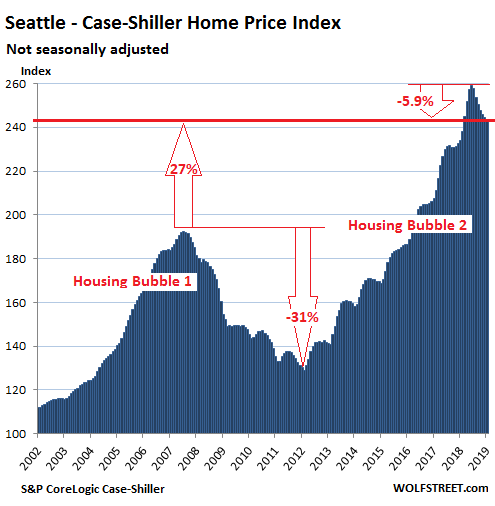
Seattle:
House prices in the Seattle metro dropped 0.3% in January, compared to December, according to the Case-Shiller Home Price Index. The index is now down 5.9% from its peak in June, the biggest seven-month drop since February 2012. This puts the index at the lowest level since February 2018, as the blistering spike early last year is now being unwound. Over the past 12 months, given the phenomenal spike early last year, the index is still up 4.0% and remains up 27% from the peak of Seattle’s Housing Bubble 1 (July 2007):
The Case-Shiller Index as a measure of house price inflation
The index is based on “sales pairs”: It compares the sales price of a house in the current month to the prior transaction of the same house years earlier (methodology). This eliminates the issues that can skew median price indices (changes in mix) and average price indices (a few big outliers). But the Case-Shiller index does not indicate prices. By tracking changes in price of the same house (sales pairs) over time, it tracks how much more it takes to buy the same house, and thereby it tracks how fast the dollar is losing purchasing power with regards to buying the same house over time. This makes the index a measure of house-price inflation.
The index was set at 100 for January 2000; a value of 200 means prices as tracked by the index have doubled since the year 2000. Every index on this list of the most splendid housing bubbles in America, except Dallas and Atlanta, has more than doubled since 2000.
So here are the remaining metros on this list of the most splendid housing bubbles in America.
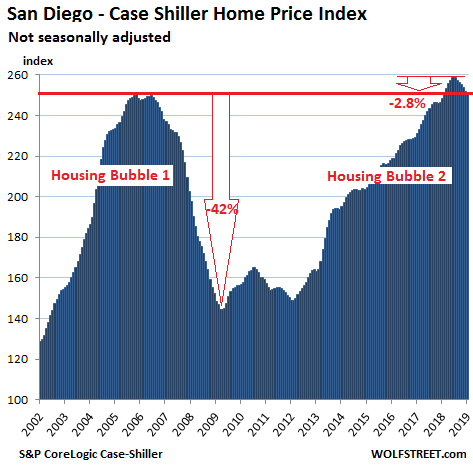
San Diego:
House prices in the San Diego metro, according to the Case-Shiller index, inched down again in January from December and are now down 2.8% from the peak in July, and at the lowest level since February 2018. It was the biggest six-month drop since March 2012, leaving the index about flat with the peak of Housing Bubble 1:
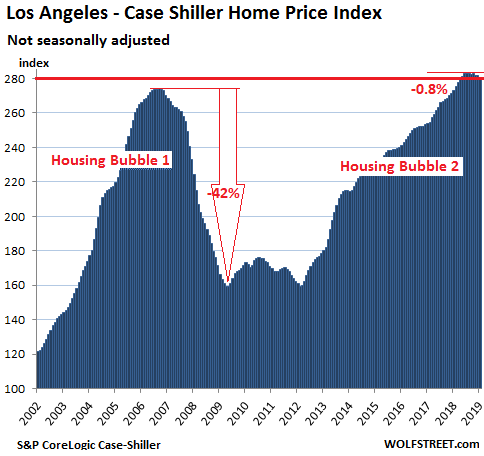
Los Angeles:
House prices in the Los Angeles metro inched down in January from December and are down 0.8% from the peak in August — a tiny increment, but the largest five-month decline since April 2012, which shows how relentless the surge of Housing Bubble 2 was. The index is up 2.9% year-over-year:
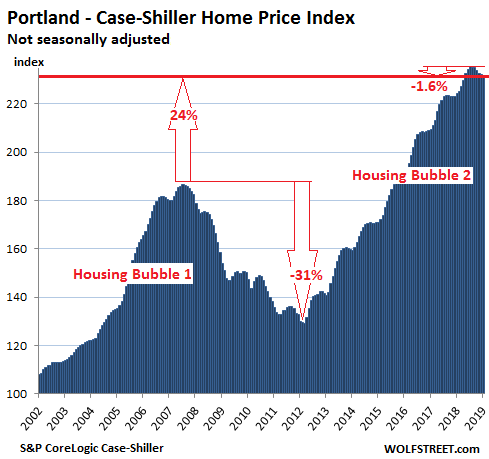
Portland:
House prices in the Portland metro, according to the Case-Shiller Index, inched down again in January from December, the sixth month in a row of month-to-month declines. The index is now down 1.6% from the peak in July 2018, the steepest six-month drop since April 2012. Year-over-year, the index is still up 3.3%:
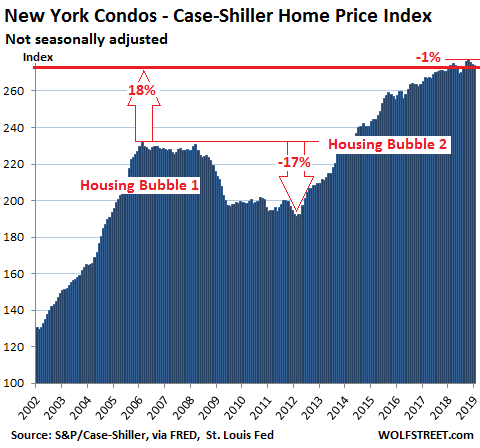
New York City Condos:
The Case-Shiller index for condo prices in the New York City metro inched down again in January from December and is down 1% from the peak in October. It’s up just 0.8% from a year ago:
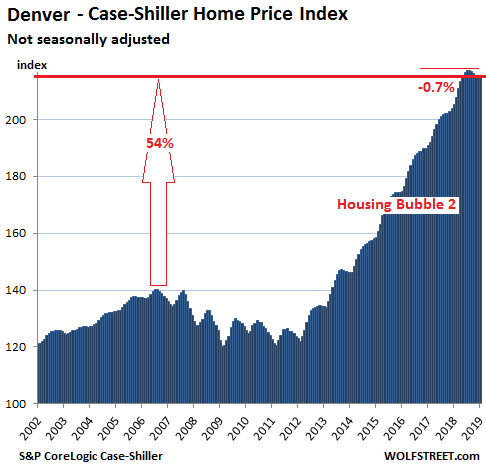
Denver:
The Case-Shiller Home Price Index for the Denver metro ticked up in January from December after four months in a row of down ticks that had followed an uninterrupted 33-month series of monthly increases. Since the peak in August, the index has declined 0.7%, don’t laugh, the biggest five month decline since March 2012. The index is up 5.0% year-over-year:
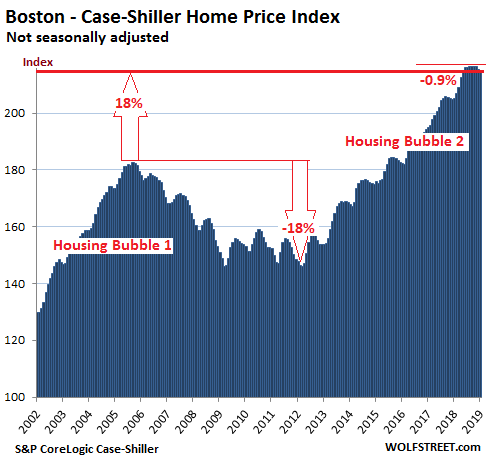
Boston:
The Case-Shiller Index for the Boston metro declined 0.4% in January from December and 0.9% from the peak in November. It’s back where it had been in May, but remains up 4.6% from a year ago:
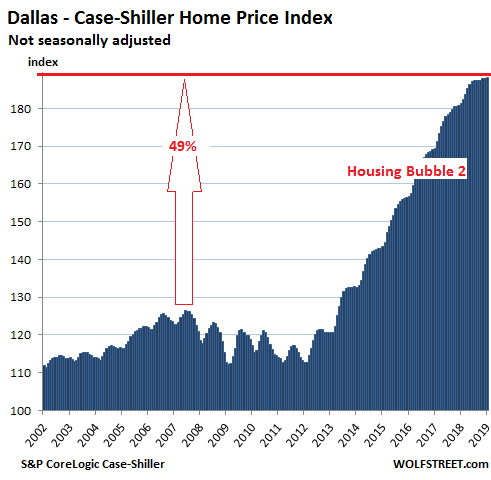
Dallas-Fort Worth:
House prices in the Dallas-Fort Worth metro ticked up in January from December and eked out a new record, having inched up 0.5% over the past seven month. This is creating a sort-of flat spot on top of this steep long surge. The index is up 3.8% year-over-year:
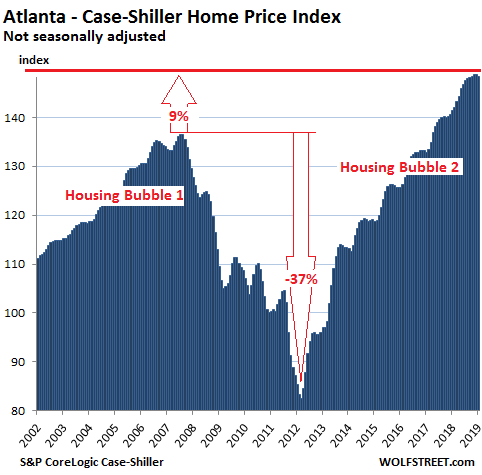
Atlanta:
House prices in the Atlanta metro, according the Case-Shiller Home Price Index, ticked down in January from the record in December. This makes the index flat for the past five months. It’s up 4.9% from a year ago:
On a national basis, these most splendid bubble-markets get averaged out with less splendid bubble-markets and with markets that have not yet seen these types of price gains. So the Case-Shiller National Home Price Index peaked in September and has since inched down to be flat with last June. Given the strength of the market in early 2018, the national index is still up 4.3% from a year ago. And it’s 11% higher than it had been at its prior peak in July 2006. Tomorrow, I will post my list of the largest housing markets that have not yet reached the peaks of the prior bubble and thus didn’t qualify for this list, such as Chicago and Miami.