Wolf Richter wolfstreet.com, http://www.amazon.com/author/wolfrichter
Seattle home prices drop at fastest pace since Housing Bust 1. Feeble declines in San Francisco, Denver, Portland, etc. Flat prices in others. Condo prices in NY City suddenly jump.
Single-family house prices in the US, according to the S&P CoreLogic Case-Shiller National Home Price Index, were essentially flat on a month-to-month basis in September, and rose 5.5% compared to a year ago (not seasonally-adjusted). This year-over-year growth rate is below 6% for the second month in row, after having been above 6% all year. This leaves the index 11.5% above the July 2006 peak of “Housing Bubble 1” in this millennium, which came to be called “bubble” and “unsustainable” only after it had begun to implode during “Housing Bust 1”:
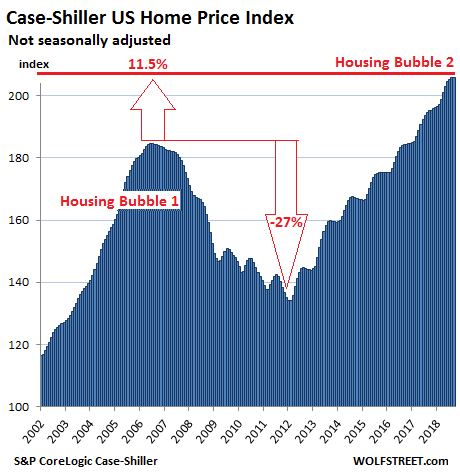
The index is a measure of inflation — not of consumer price inflation but of asset price inflation, specifically house-price inflation. It shows to what extent the dollar is losing purchasing power with regards to buying the same house over time.
The fundamentals of the hottest housing markets around the country have been weakening for months, with declining sales and rising inventories. On the West Coast, this inflection point occurred in July. Prices in those markets, as tracked by the Case-Shiller Index, are gradually reflecting the new reality. But “gradually” is not the right word for formerly piping-hot Seattle, where prices are now dropping at the sharpest rate since Housing Bust 1.
So here are the most splendid housing bubbles in major metro areas in the US:
Seattle:
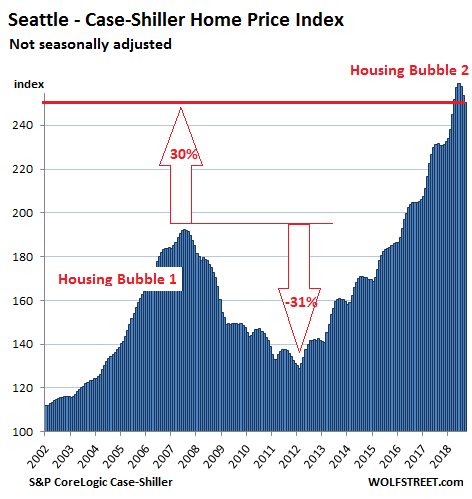
House prices in the Seattle metro dropped 1.3% in September from prior month, after having dropped 1.6% in August, and 0.5% in July, according to the Case-Shiller Home Price Index. Over those three months, the index dropped 3.5%, the sharpest such decline since December 2011, during Housing Bust 1. So home prices are beginning to unwind a historic spike. The index is now below where it had been in April. This confirms that the inflection point — when the direction changes — was in July and that conditions have deteriorated since.
Over the past 12 months, the index is still up 8.4%, down from the 12.0% year-over-year surge in July. The index is up 30% from the peak of Seattle’s Housing Bubble 1 (July 2007), but that is down from the 35% increase in the July reading:
The Case-Shiller Home Price Index is a rolling three-month average; today’s release is for July, August, and September data. Based on “sales pairs,” it compares the sales price of a house in the current month to the prior transaction of the same house years earlier. The index incorporates other factors and formulas to arrive at each data point. Unlike median-price incidences, it does not provide dollar-price levels. It was set at 100 for January 2000; hence, an index value of 200 means prices as tracked by the index have doubled.
Dallas-Fort Worth:
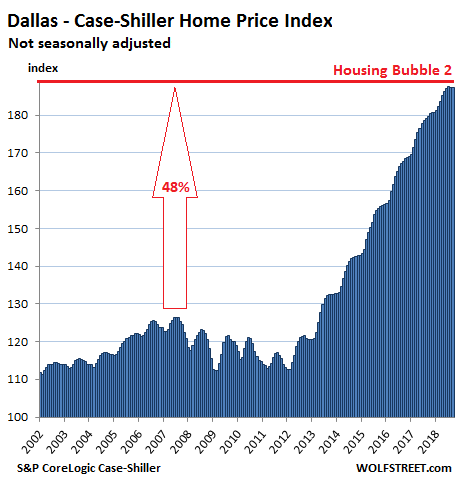
The Case-Shiller index for the Dallas-Fort Worth metro in September was flat with August and July. This three-month flat spot comes after a glorious run of 54 monthly increases in a row. The index is up 4.3% year-over-year — down from the 5.0% year-over-year increase in July. Since its peak during Housing Bubble 1 in June 2007, the index has surged 48%:
Boston:
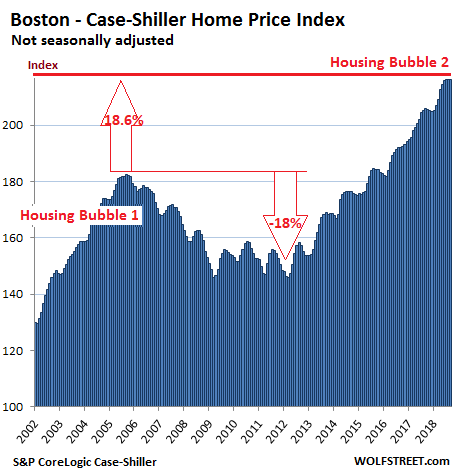
House prices in the Boston metro in September were essentially flat on a monthly basis for the fourth month in a row. They remain up 5.0% from a year ago, but that’s down from a 6% year-over-year increase earlier this year. The index exceeds the crazy peak of Housing Bubble 1 by 18.6%:
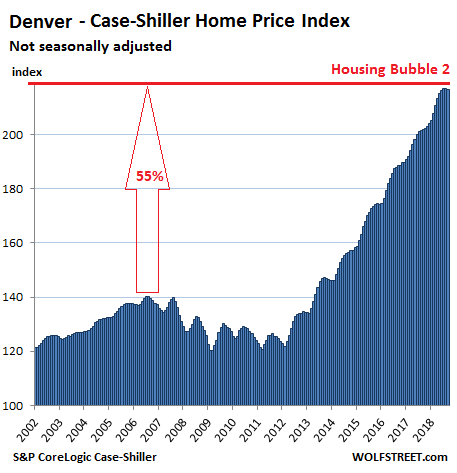
Denver:
Prices in the Denver metro fell in September from August and from July, the second month in a row of declines, after a run of 33 monthly increases in a row. The index is up 7.3% from a year ago (down from an 8.0% pace earlier this year):
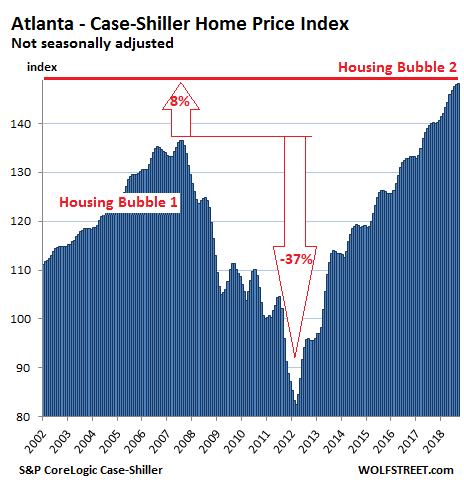
Atlanta:
Atlanta’s Housing Bubble 2 is still on track: The Case-Shiller index for the metro rose 0.2% in September from August, and 5.7% over the 12-month period. Prices exceed the peak of Atlanta’s Housing Bubble 1 in July 2007 by just over 8%:
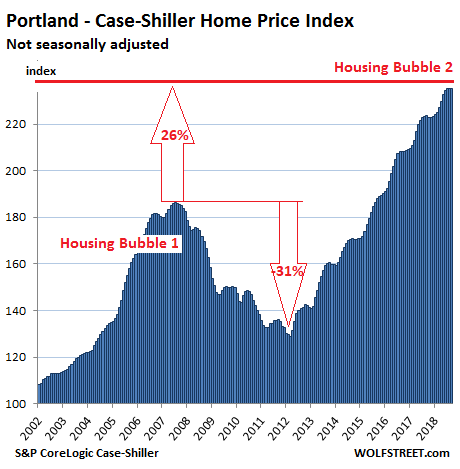
Portland:
The Case-Shiller index for the Portland metro in September edged downagain on a monthly basis, the second month in a row of tiny declines. The index is up 5.1% year-over-year (down from the 5.6% pace early in the year) and up 26% from the stupendous peak of Housing Bubble 1 in July 2007:
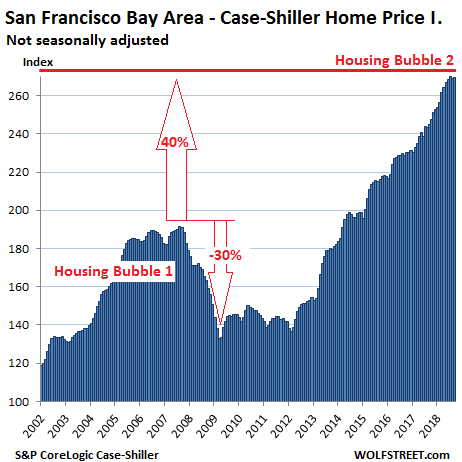
San Francisco Bay Area:
The San Francisco Bay Area has the malaise too! The Case-Shiller index for “San Francisco” includes five counties: San Francisco, the northern part of Silicon Valley (San Mateo County), part of the East Bay (Alameda and Contra Costa), and part of the North Bay (Marin). In September, the index was flat with August and slightly down from July. It was still up 9.9% from a year ago, but that pace is down from the double-digit gains earlier this year. This index remains 40% above the peak of Housing Bubble 1:
The Case-Shiller index tracks condo prices in the five-county San Francisco Bay Area separately, and this index is now down 0.6% from its peak in June.
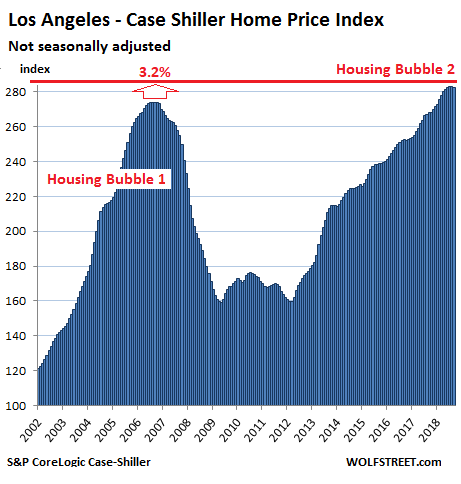
Los Angeles:
House prices in the Los Angeles metro too fell in September from August and are back where they had been in June. The year-over-year gain of 5.5% was down from well over 6% earlier this year. Between January 2000 and July 2006, the index had ballooned 174% before collapsing. The index now exceeds the crazy peak of Housing Bubble 1 by 3.2%:
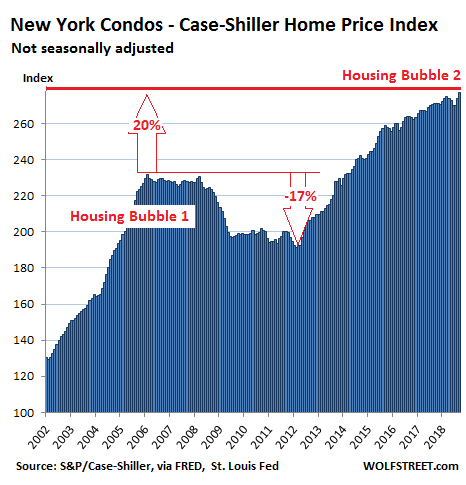
New York City Condos:
Condo prices in the New York City metro jumped 1.2% month-to-month in September, after having jumped 1.3% in August, after several months of declines, according to the Case-Shiller condo index. The September jump pulled the index up 2.3% year-over-year, to a new record, after having been nearly flat on a year-over-year basis two months earlier:
Some markets covered by the Case-Shiller index such as Miami, Las Vegas, and Chicago have not yet reached their highs of Housing Bubble 1, so they don’t yet fit into this theme of the “Most Splendid Housing Bubbles in America.” But other markets that would fit perfectly into the theme, such as the Nashville metro, are not covered by the Case-Shiller data.