by Dana Lyons
Volatility continues to be the theme on Wall Street as exemplified by yesterday’s action. The S&P 500, for example, plunged nearly 2% at one point during the day before rallying all the way back to close higher on the day. And, in fact, it was the 2nd such reversal in the past few days as last Thursday saw the index drop nearly 3% at one point before closing near the unchanged mark. Now while they do underscore the present volatility, these 2 recoveries perhaps mask a rare streak on selling pressure in the S&P 500.
Specifically, regardless of the closing performance, the past 4 days have seen the S&P 500 drop at least 1.89% each day on an intraday basis. That is just the 11th streak of such selling pressure in the S&P 500 going back to 1960, and the first since 2008.
If we relax the parameter a bit to 4 straight intraday drops of at least 1.7%, we observe 17 occurrences going back to 1960. Many of them occurred at interesting market junctures.
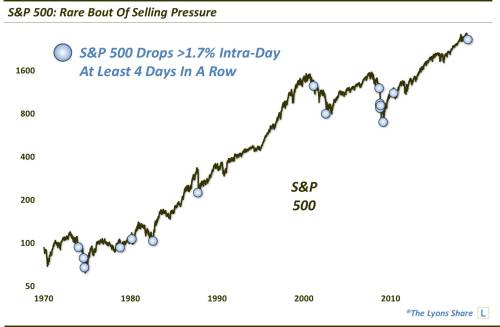
As the chart displays, several of these instances occurred in the direct vicinity of cyclical market bottoms, including 1974, 1982, 1987, 2002 and 2009. That might give bulls some hope that perhaps things have gotten so bad, i.e., rock bottom, that there’s nowhere to go but up. Although, it is probably a stretch to conclude that we are at a cyclical low right now since we were at all-time highs just about 10 weeks ago. And looking back at the chart, we see that some of the other historical events, e.g., 1974, 2001, 2008, occurred during the meat of a bear market and saw stocks just continue to fall further, going “subterranean” if you will.