Wolf Richter wolfstreet.com, http://www.amazon.com/author/wolfrichter
Let the good times roll.
Total consumer credit – or less soothingly, consumer debt – rose 4.8% in the second quarter from a year earlier, or by $176 billion, to $3.87 trillion (not seasonally adjusted), the highest ever, according to the Federal Reserve. This includes credit-card debt, auto loans, and student loans, but not mortgage-related debt. Given how passionate Americans normally are in spending money they don’t have – that 4.8% increase is moderate: In 2011, increases exceeded 11%.
The chart below shows the progression of consumer debt since 2006. After the seasonal hangover in Q1, following the spend-and-borrow party in Q4, consumer debt set a new record in Q2:
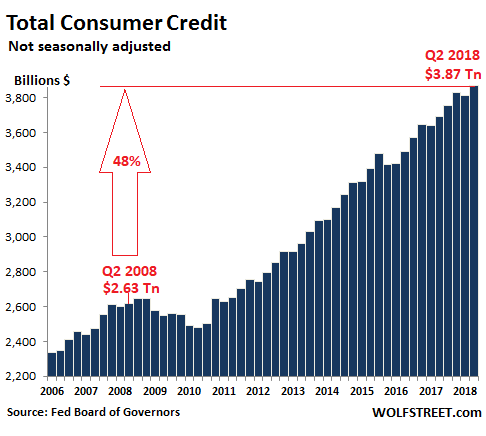
To put this 4.8% increase in perspective: In Q2, the economy as measured by real GDP grew 2.8% year-over-year, and inflation as measured by CPI increased 2.7%. In other words, American consumers, among the hardiest creatures out there, have pulled through once again, holding up the economy with borrowed money.
Over the 10 years since Q2 2008, consumer debt has surged 48%. Over the same period, the consumer price index has increased 15.1%, and the economy has grown 17.8%.
Auto loans and leases
Auto loans and leases for new and used vehicles rose by 3.6% from a year ago, or by $40 billion, to a record of $1.13 trillion.
The percentage increase is in line with the past four quarters, but a far cry from the peak of auto euphoria in Q3 2015, when auto loan balances jumped by 9%. Loan balances are impacted by prices of vehicles, including the mix of new and used, number of vehicles financed, the average loan-to-value ratio, duration of prior loans, and other factors:
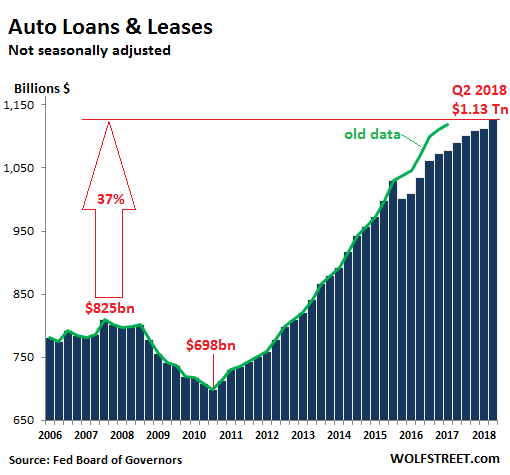
The green line in the chart shows the old data. In September 2017, the Federal Reserve adjusted its consumer credit data going back through Q4 2015, based on survey data collected every five years. The adjustments hit auto-loan balances disproportionately, knocking them down by $38 billion retroactively to Q4 2015. To show the distortive effect of the adjustment – and to show that it wasn’t the collapse of the car business – I added the old data in green.
Revolving credit
Credit card debt and other revolving credit in Q2 rose 5% year-over-year to $1.0 trillion (not seasonally adjusted). This growth rate was down from the spectacular 5.6% to 6.8% increases from Q4 2016 through Q4 2017 (the “Trump bump”). But it’s still among the biggest increases since the Financial Crisis. On a quarterly basis, in line with seasonal patterns, it rose by $24 billion from hangover-Q1 that invariably follows the shopping-season debt-pile up in Q4:
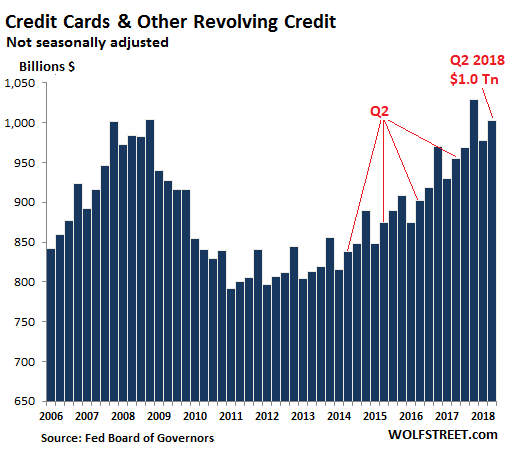
A special note about the records in credit card balances: The $1.03 trillion in Q4 2017 had been an all-time record, finally beating the records of the fourth quarters in 2007 and 2008. And Q2 2018 set a record for any second quarter. In the history of the universe, these revolving credit balances exceeded the $1 trillion mark only four times: three of them in fourth quarters (Q4 2007, Q4 2008, Q4 2017) and now suddenly in a Q2.
So Americans are nailing it with credit cards, the most profitable form of lending for banks, where interest rates can exceed 30%, though the average cost of funding for banks is still below 1%. This is a deal made in heaven for banks – until consumers collapse under this high-interest debt.
The Student-loan economy
Student loans in Q2 jumped by 5.8%, or by $84 billion, year-over-year to $1.53 trillion (not seasonally adjusted). While this may sound like a shocking increase, it’s among the slowest year-over-year percent increases going back to 2007; up through Q3 2012, year-over-year increases ranged from 11% to 15%!
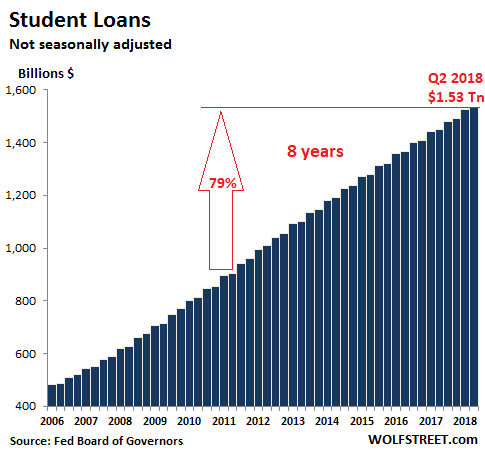
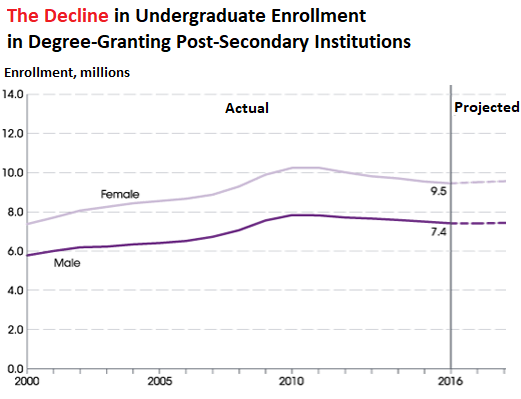
But wait… Higher-education enrollment peaked in 2010. In the eight years since, it has declined for both male and female undergraduate students, according to the latest data available from the National Center for Education Statistics (updated in May 2018). Total enrollment in 2016 fell to 16.9 million, down 6.6% from the peak of 18.1 million in 2010. This chart shows male and female enrollment, actual and projected, via NCES:
And yet, over the eight years since 2010, as enrollment has dropped, student loan balances have soared by a dizzying 79%, or by $976 billion, from $855 billion to $1.53 trillion.
But it’s good for the economy, no? Whole industries have mushroomed around this manna. Investors in for-profit colleges; the student housing industry; companies like Apple that sell students can’t-live-without gadgets and services; the ravenous textbook industry; overpaid top administrators; construction companies building university-owned trophy projects; banks; they’re all getting fat on this manna. It’s just that future consumers and finally taxpayers are now on the hook for $1.5 trillion.
In terms of consumer debt, it’s not those consumers with high incomes and plenty of money in the bank who are paying off their credit cards on a monthly basis that are at risk. It’s consumers who use their credit cards to make ends meet, who carry large balances and struggle to make minimum payments, and who have no money in the bank. That’s where the risks are – with the most vulnerable 25% on the consumer-credit scale, the very ones who carry a disproportionate amount of very expensive credit-card debt that can be devilishly hard to pay off or even service.