Wolf Richter wolfstreet.com, http://www.amazon.com/author/wolfrichter
It was one gigantic party. But wait…
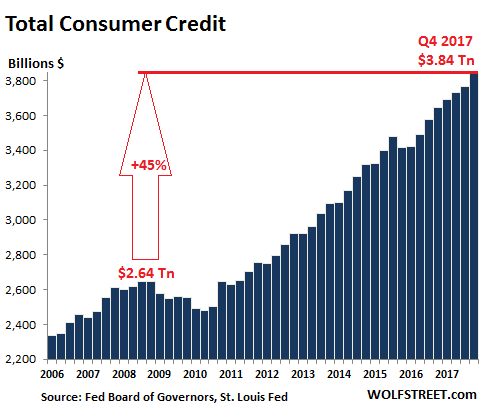
Total consumer credit rose 5.4% in the fourth quarter, year over year, to a record $3.84 trillion not seasonally adjusted, according to the Federal Reserve. This includes credit-card debt, auto loans, and student loans, but not mortgage-related debt. December had been somewhat of a disappointment for those that want consumers to drown in debt, but the prior months, starting in Q4 2016, had seen blistering surges of consumer debt.
Think what you will of the election – consumers celebrated it or bemoaned it the American way: by piling on debt.
The chart below shows the progression of consumer debt since 2006 (not seasonally adjusted). Note the slight dip after the Financial Crisis, as consumers deleveraged – with much of the deleveraging being accomplished by defaulting on those debts. But it didn’t last long. And consumer debt has surged since. It’s now 45% higher than it had been in Q4 2008. Food for thought: Over the period, the consumer price index increased 17.5%:
Credit card debt and other revolving credit in Q4 rose 6% year-over-year to $1.027 trillion, a blistering pace, but it was down from the 9.2% surge in Q3, the nearly 10% surge in Q2, and the dizzying 12% surge in Q1. So the growth of credit card debt in Q4 was somewhat of a disappointment for those wanting to see consumers drown in expensive debt.
The chart below shows the leap of the past four quarters over prior years. This pushed credit card debt in Q3 and Q4 finally over the prior record set in Q4 2008 ($1.004 trillion), before it came tumbling down via said “deleveraging.”
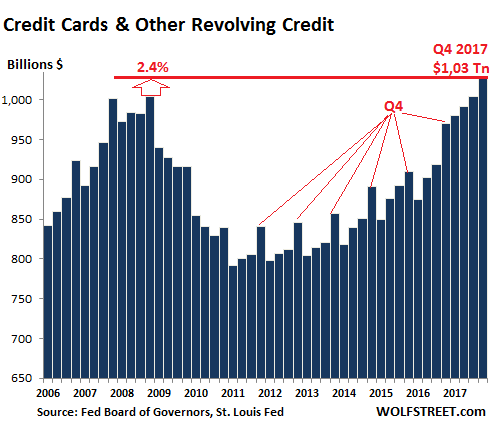
These are not seasonally adjusted numbers, and you can see the seasonal surges in credit card debt every Q4 during shopping season (as marked), and the drop afterwards in Q1. But then came 2017. In Q1 2017, credit card debt skyrocketed to an even higher level than Q4, when it should have normally plunged – a phenomenon I have not seen before.
This shows what kind of credit-card party 2017 and Q4 2016 was. Over the four quarter period, Americans added $58 billion to their credit card debt. Over the five-quarter period, they added $109 billion, or 12%! Celebration or retail therapy.
Auto loans rose 3.8% in Q4 year-over-year to $1.114 trillion. It was one of the puniest increases since the auto crisis had ended in 2011. Since then, the year-over-year increases were mostly in the 6% to 9% range. These are loans and leases for new and used vehicles. So the weakness in new-vehicle sales volume in 2017 was covered up by price increases in both new and used vehicles in the second half and strong used-vehicle sales:
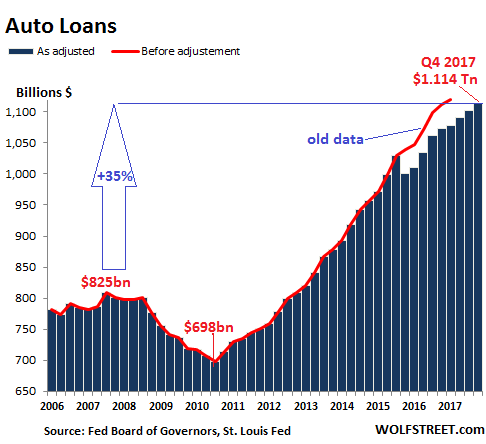
The red line in the chart above indicates the old unadjusted data. In September 2017, the Federal Reserve announced a big adjustment of consumer credit data going back through Q4 2015, impacting auto loans, credit card debt, and total consumer credit. This adjustment was based on survey data collected every five years. So routine. But for Q4 2015, the adjustment knocked auto loan balances down by $38 billion.
Hence that misleading dip in auto loans in Q4 2015 in the chart above. This was at the peak of the auto-buying frenzy, and actual auto-loan balances certainly rose.
Student loans surged 5.6% in Q4 year-over-year. This seems like a shocking increase, but the year-over-year increases in Q3 and Q4 were the only such increases below 6% in this data series. Between 2007 – as far back as year-over-year comparisons are possible in this data series – and Q3 2012, the year-over-year increases ranged from 11% to 15%:
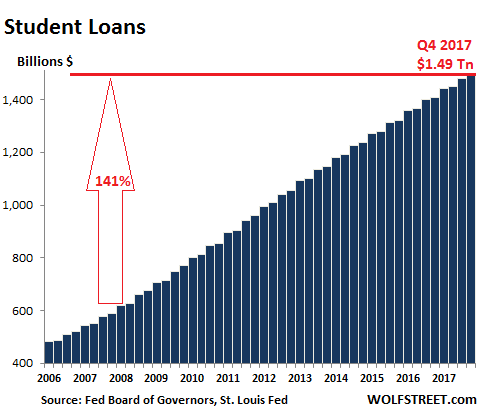
And there was no dip in student-loan balances during the Financial Crisis; in fact, those were the years with the steepest growth rates. From Q1 2008 to Q4 2017, student loan balances soared 141%, from $619.3 billion to $1.49 trillion, multiplying by 2.4 times over those ten years. More food for thought: Over the same period, the consumer price index rose 17.5%.
The problem with debt is that it doesn’t just go away on its own. If one side cannot pay, the other side takes a loss on their asset. Some auto loans and credit card debts remain on the balance sheet of lenders, while others have been securitized and are spread around among investors. But most student loans are guaranteed by the taxpayer or directly funded by the government.
Over the years, student loans have fattened entire industries: Investors in private colleges, the student housing industry (an asset class within commercial real estate), Apple and other companies supplying students with whatever it takes, the textbook industry…. They’re all feeding at the big trough held up by young people and guaranteed by the taxpayer. Food for thought, so to speak.
In terms of corporate debt, it’s only a question of how disruptive the adjustment will be, whether it will be just a sell-off or junk-bond mayhem. Read… Corporate Bond Market in Worst Denial since 2007