via Zerohedge:
In “Where The American Dream Goes To Die“, we published some of the most recent, concerning observations on the current state of the US housing market. Now, courtesy of Deutsche Bank, for our lazier readers, here is a visual recap of the recent turning point in US housing, in which DB’s Torsten Slok uses an array of charts to demonstrate that “US Housing is cooling down” as the the negative SALT impact is overshadowing low mortgage rates, high consumer sentiment, and record-low unemployment rate.
Here are the main highlights:
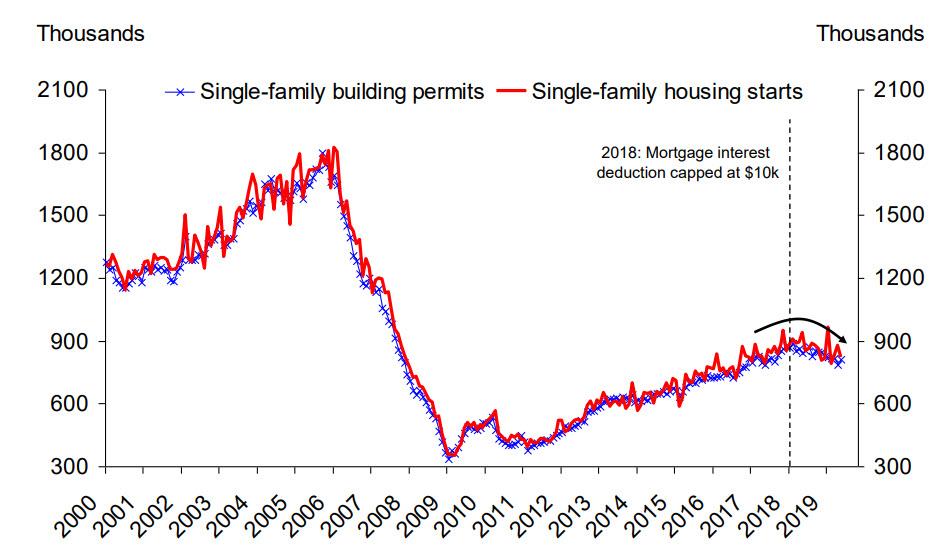
Single-family starts and permits rolling over despite lower mortgage rates and low unemployment rate

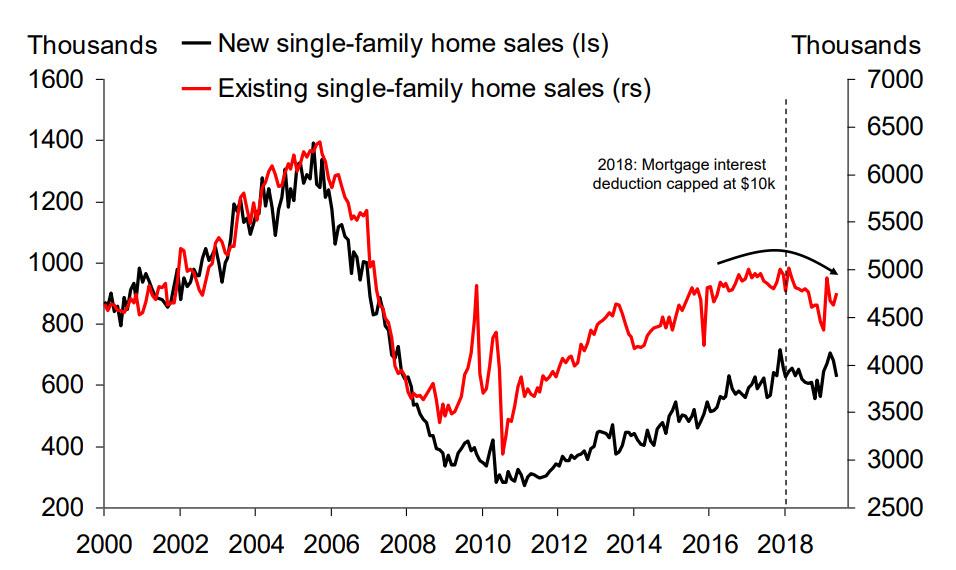
Existing single-family home sales and new single-family home sales not rebounding despite very low mortgage rates
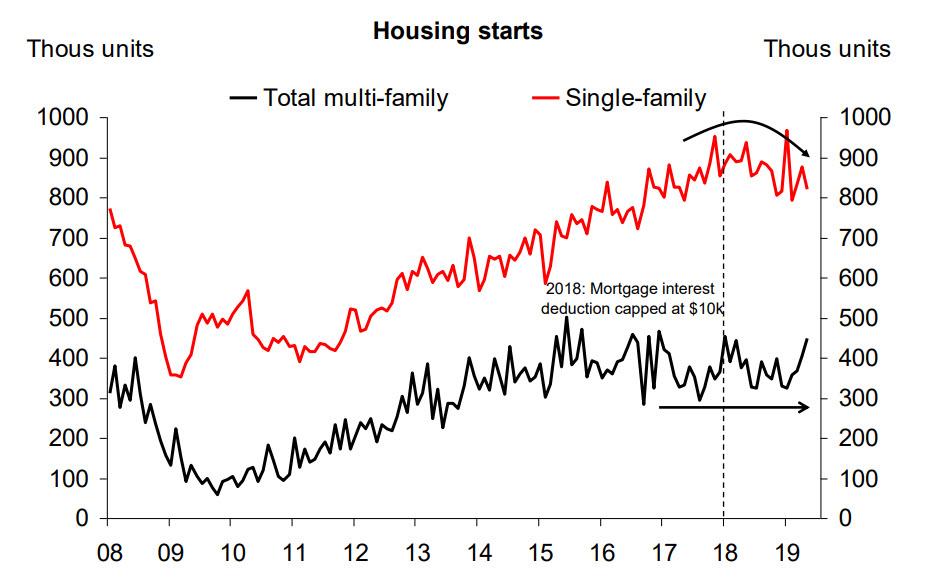
Single-family starts cooling down, multi-family sideways
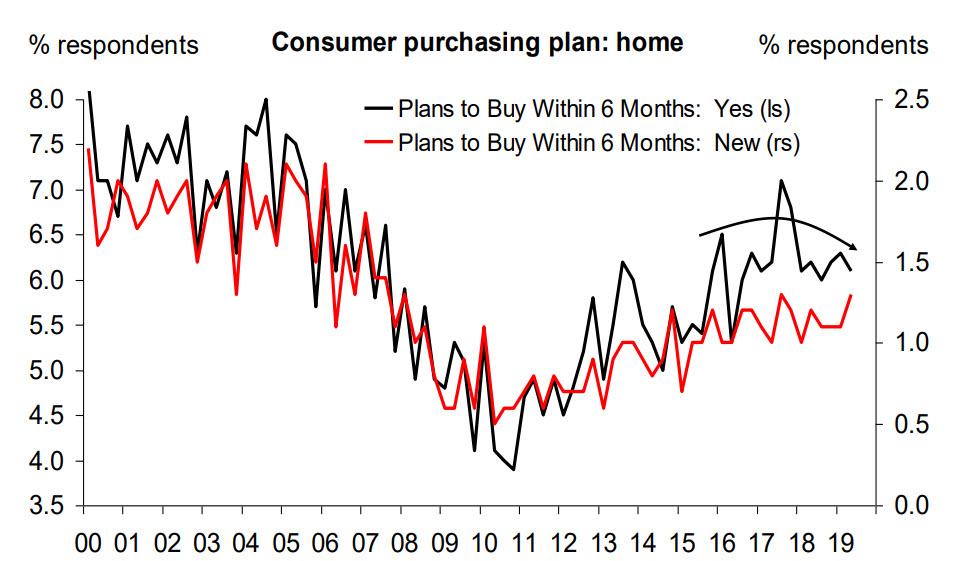
Lower mortgage rates and low unemployment not doing much to boost consumer plans to buy a house
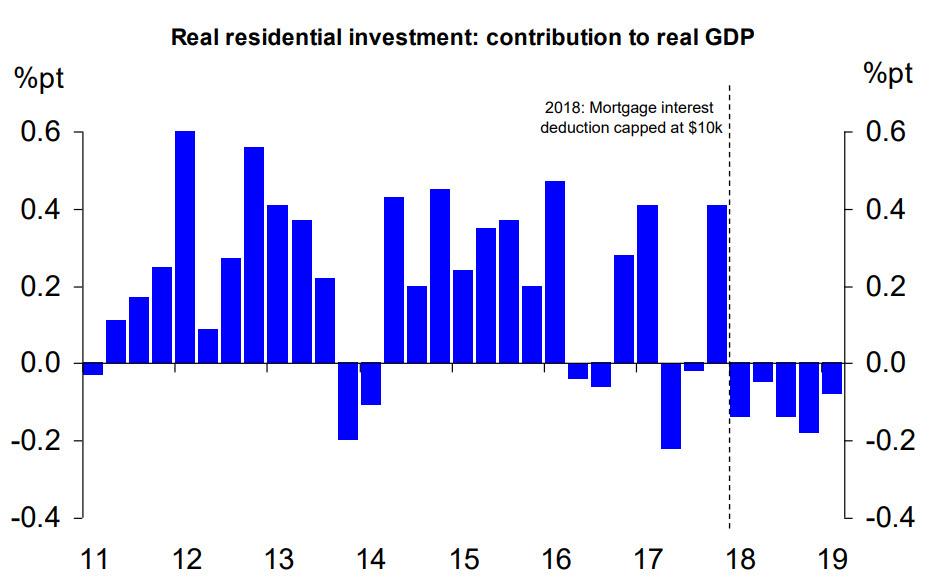
Residential investment is shrinking despite low mortgage rate and low unemployment rate
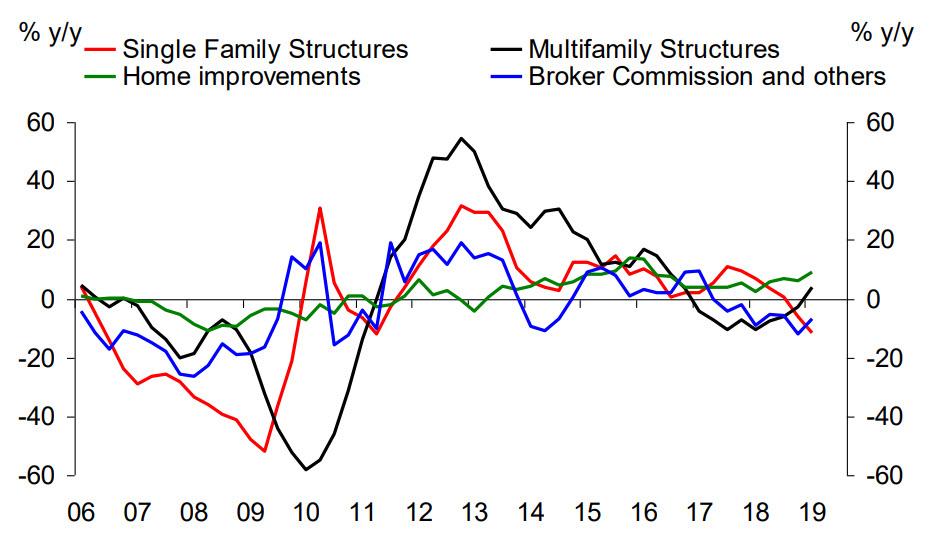
Year-over-year growth in housing components contribution to GDP
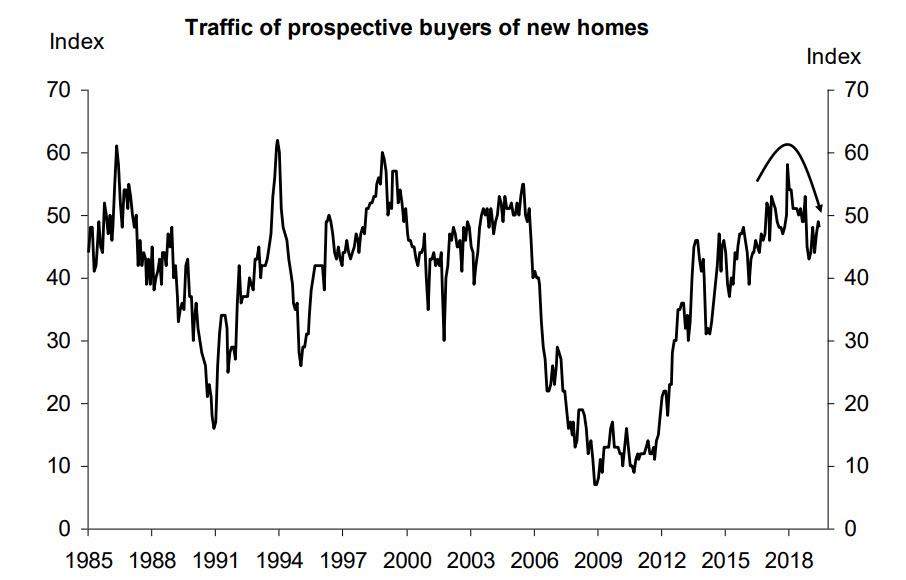
Interest in home buying rolling over
Home price appreciation trending down

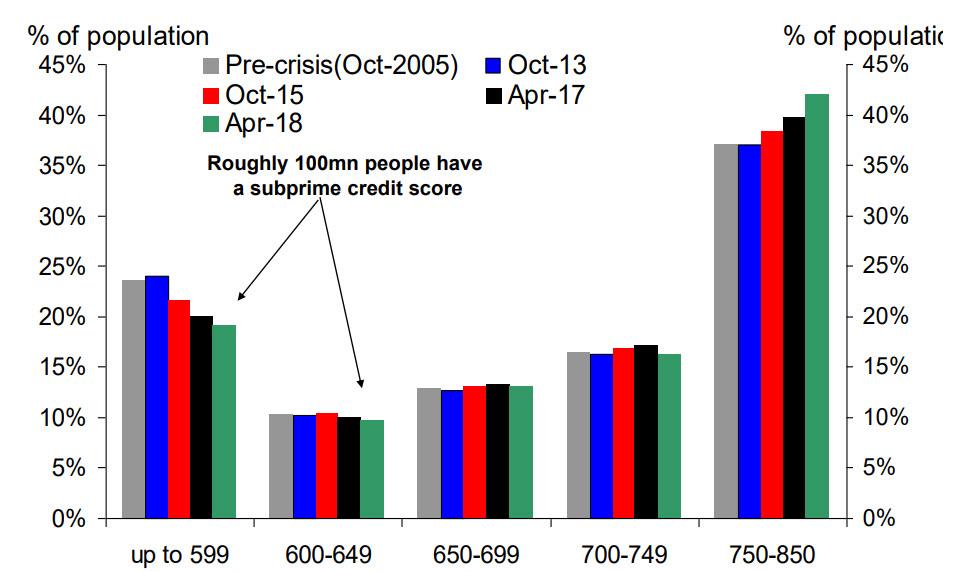
Fewer subprime borrowers today. And more people with top credit scores. And still housing is cooling down
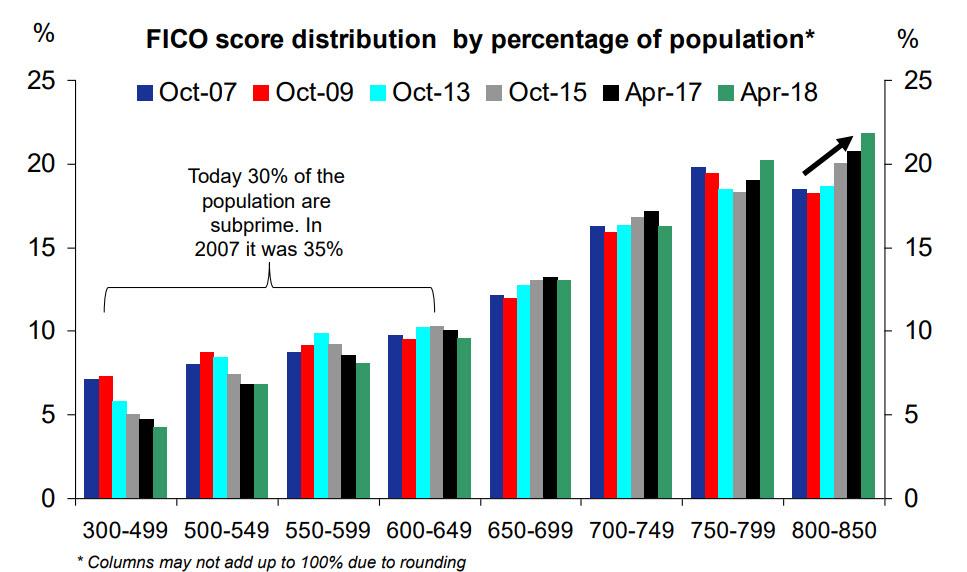
30% of the population have a subprime credit score
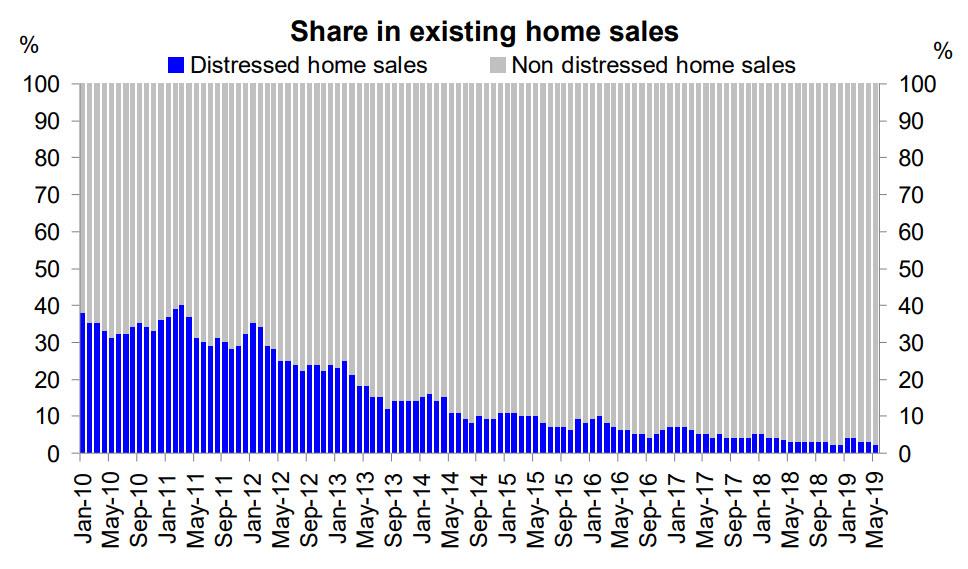
Almost no distressed home sales
Homeownership rate still far below its peak despite low mortgage rate and low unemployment rate
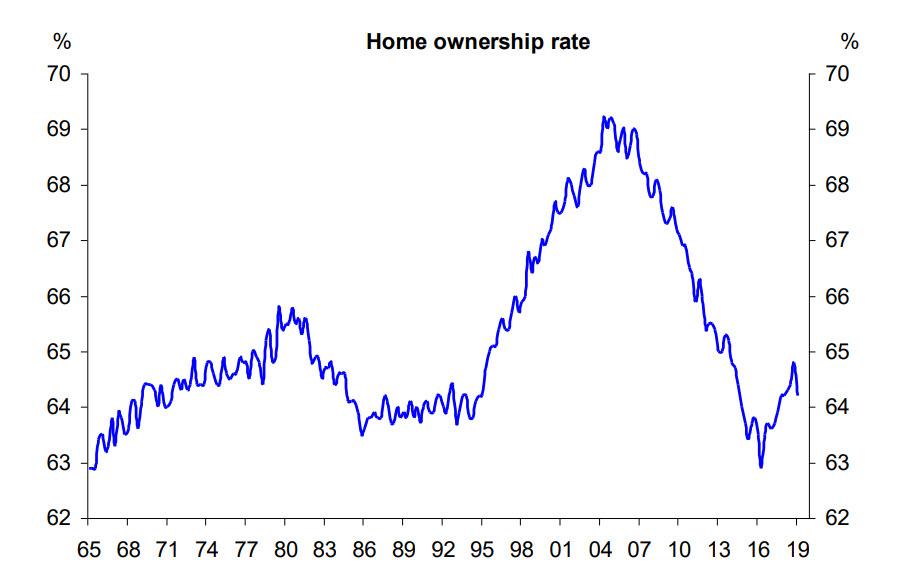
Since the homeownership rate peaked in 2006 the number of households renting has increased by roughly 10 million

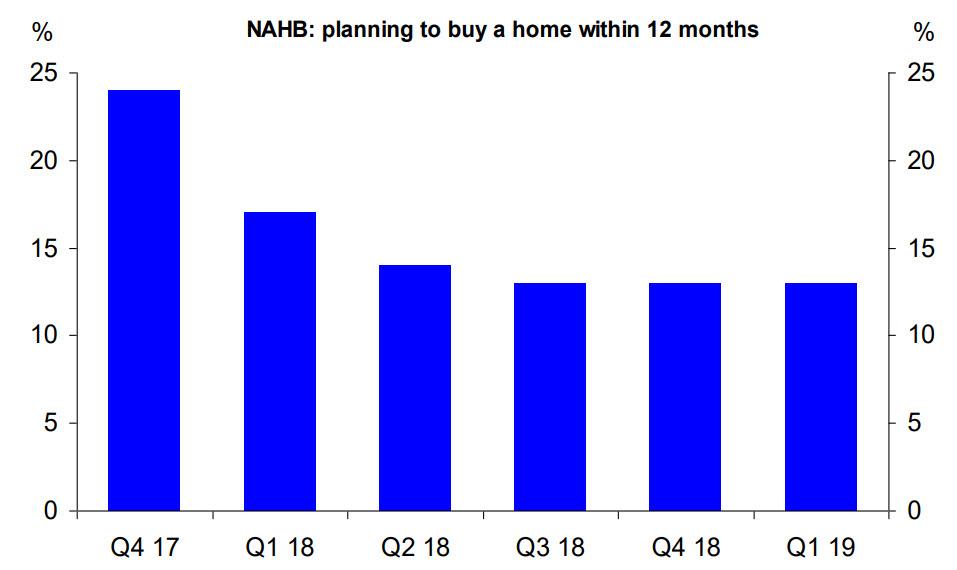
Fewer people plan to buy a home within 12 months despite low unemployment rate and low mortgage rate
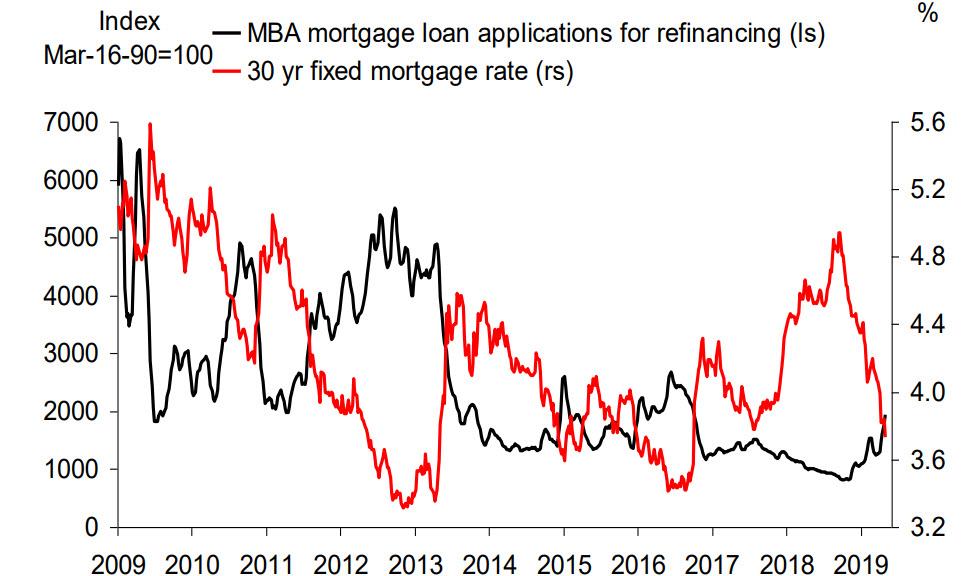
Mortgage refi application activity up but not much when taking into account how much mortgage rates have declined
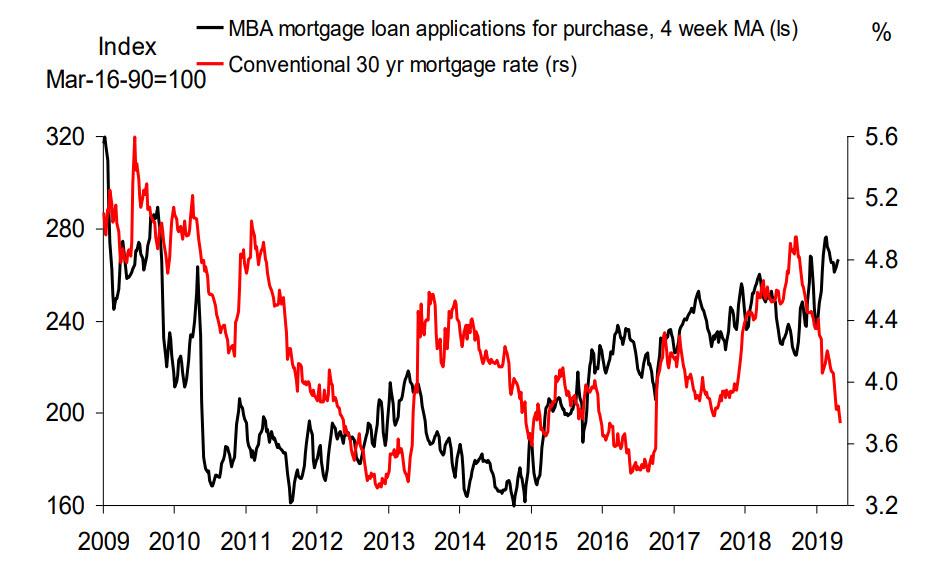
Purchase applications up but not much when taking into account how much mortgage rates have fallen
Manhattan home prices falling at the fastest rate since the financial crisis

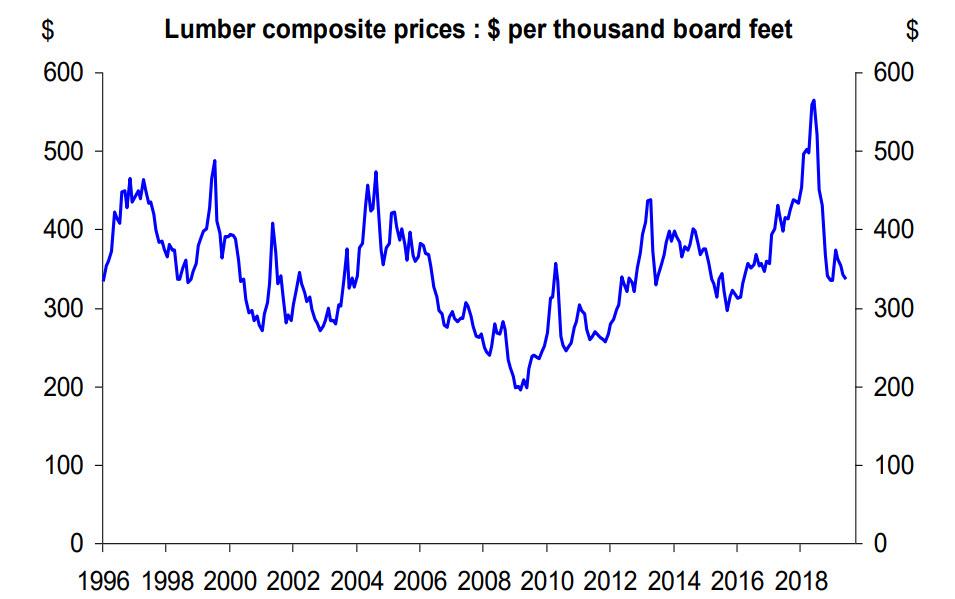
Lumber prices down recently
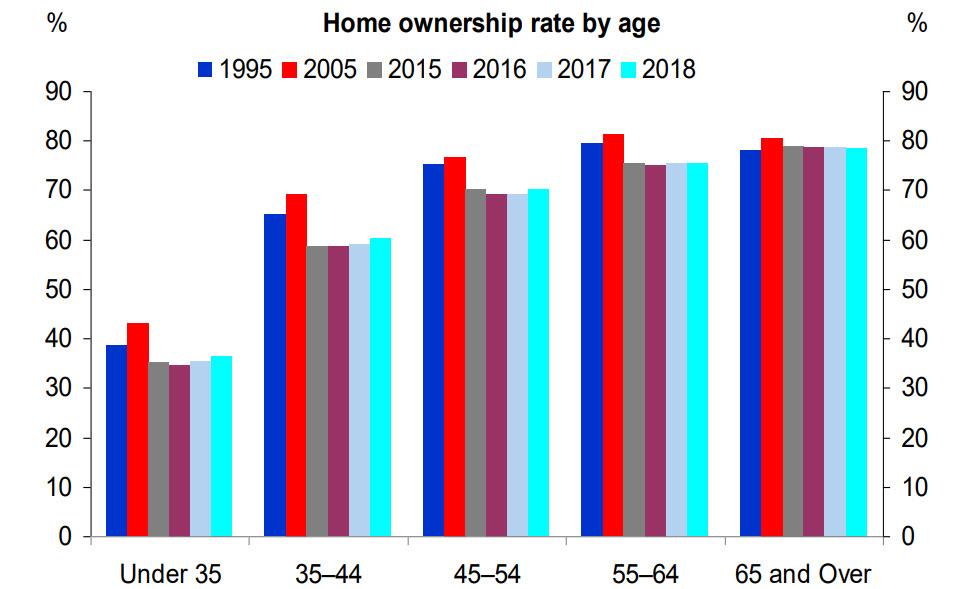
Home ownership rates still below pre-crisis level across age groups
Geographical distribution of housing boom/bust
