via innovationexcellence:
While there is no one magic indicator of the market’s future, these three may provide some of the best insights into the current and future state of the economy.

Warren Buffett once said, “Be fearful when others are greedy and greedy when others are fearful.”
In August of 2007, I had a meeting with the CEO one of the largest U.S. banks. At the time, the initial rumblings of the bank crisis, and the underpinnings of the great recession to follow, were starting to make headlines.
In a private one-on-one I asked him what he thought of all the commotion at what was then the tail end of a fairly healthy market recovery, after the bursting of the dot-com bubble in 2001. I’ll never forget his very straightforward and simple, but emphatic, response: “This has the potential to be the worst crisis I’ve seen in all my years of banking!”
Why I didn’t go to an all cash portfolio at that point I’ll never be able to explain.
In retrospect, his prescience was somewhat ironic, as his was one of the banks closed down in the aftermath of the crisis.
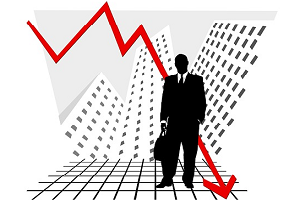
If It Can’t Get Better, It Can Definitely Get Worse
Fast-forward to the present. At just about 3,500 days, the current bull run is the longest recorded in the history of the stock market. Expecting it to last indefinitely is a game for fools. We all know that markets have cycles. The average cycle, from peak to peak of a bull market or trough to trough of a bear market, is 5 1/2 years. Clearly, we’re way overdue for a downturn. Of course, the real question isn’t if but when the next recession will arrive; every cycle has its end. Of this much all but the most delusional among us are certain.
But the question we all want answered is, when?
You’ve likely seen countless prognostications from pundits who claim to have figured out how some magic indicator can do just that by pointing unequivocally to the next market crash. Don’t believe any of it. The fundamental flaw in every singular indicator (or individual) is that, while they may have 100 percent accuracy in predicting recessions, they also give many false positives. The analogy would be my saying that hangovers always follow drinking alcoholic beverages. That’s true, but there are many times that drinking alcoholic beverages did not result in a hangover.
While there is no one way to predict a recession, there are ways to begin tracking multiple factors that may collectively stand a much higher chance of predicting accurately the probability of one within a given time frame. Here are three of the more popular predictors of a market downturn that I’ve been following.
1. An Inverted Yield Curve
This one sounds obtuse but it’s actually very easy to track and almost always an indicator of lacking confidence in economic health. Very simply put, an inverted yield curve occurs when the yield (the return an investor in bonds receives) on bonds with a short duration exceeds the yield on bonds with a longer duration.
The reasons for the inversion are a bit counterintuitive. It’s not that investors have greater faith in the near term, but rather that the demand for short-term bonds is so low that the bonds must offer a higher return to attract investors. At the same time, demand for long-term bonds is so great that they do not have to offer as high of a yield. Why are investors going to bonds with a longer term? Because they are losing faith in the short term.
Yield curves don’t typically invert. When they do, it creates an anomaly worth looking at. An inverted yield curve has preceded each of the past seven recessions. (It’s also provided two false positives in that same time.) To be clear, we are not experiencing an inverted yield curve at present, but as the Fed continues to increase the funds rate–the interest rate at which depository institutions (banks and credit unions) lend reserve balances to other depository institutions–we may get precariously close to an inversion.
If you take a look at the Treasury yield curve for 2007, it’s clear that something was brewing. You can use the interactive yield curve tables on the Treasury Department’s site to look at how the yield curve has changed over the years, including where it currently stands, which is, according to the Chicago Fed, predicting only a 16.5 percent chance of a recession in the next year.
2. The VIX
The VIX is an index that is tied to market volatility using S&P 500 index options. Also known as the Chicago Board Options Exchange Volatility Index (CBOE VIX), it is one of those frequently talked about indicators of the market’s anxiety and concern over short-term future market performance.
Looking at a chart of the VIX over the past 30 years, it’s clear that it has experienced spikes that are coincident with recessions or market corrections. For example, check out the spike in 2008.
Today, the VIX is relatively low, clocking in at its average value over the past 30 years (just over 12, compared to nearly 90 in October 2008). The challenge with the VIX is determining how high a spike will go, since it oscillates from day to day. What may appear to be a trend up can quickly reverse within hours.
I’ve found the VIX to be a great near-term predictor of perceived market health. In some cases, it is even useful for predicting intraday market movements. Again, it’s no panacea for worried investors, just one more arrow in your quiver.
According to Dan Caplinger, who writes for the Motley Fool, “By itself, the CBOE VIX won’t give you a perfect prediction of what the stock market is about to do; but it can nevertheless provide evidence regarding what other investors are thinking about current conditions, and offer at least one view of what the future might bring for stock investors.”
3. Market Cap to GDP
This is one of my all-time favorites, partly because it comes from Warren Buffett, but also because it makes deep intuitive sense. Not that markets are in anyway intuitive, but it has a sort of “Oh yeah, I get it” quality to it.
The way it works is that equities are overpriced when the total market cap (TMC) of all equities surpasses the value of GDP.
The “a-ha!” quality is that you can rationalize that the worth of a company should be somehow related to the output of an overall economy. The problem is that the lion’s share of market capitalization comes from companies that are global to begin with. So their relationship to U.S. GDP is a tenuous one, at best.
Besides, it’s not actually that black and white. There are many variations of the TMC-to-GDP formula that look at a subset of equities, such as the Wilshire 5000, and compare the ratio of TMC for that subset to GDP.
Warren Buffett is most often credited with popularizing this indicator. According to Buffett, in a 2001 Fortune interview, “it is probably the best single measure of where valuations stand at any given moment.”
To be fair, Buffett never said that this was an indicator of a downturn per se, just that it reflects the relative value of equities.
So, by way of example, if the ratio of TMC is at 75 percent of GDP, equities are undervalued (as a group). If TMC is at 150 percent of GDP, then it’s a fair bet that equities are overvalued.
Today (September 30, 2018) TMC is at 147.8 percent of GDP.
But that’s the definition of a bull market, right? Equities are attractive because we expect a brighter future. True, but again, there’s a point at which perception exceeds reality, and that’s what this indicator points to.
Unforeseen Catalysts
These are just three indicators out of myriad others that help to project the market’s health and future prospects. I’d be a fool, and you’d be an even bigger fool, to expect that this or any analysis can precisely pinpoint when the market will retreat.
It’s also the case that the catalysts which topple a bull market are often the unknowable ones. These are existential threats that come out of an unforeseen or barely visible source. We all knew the dot-com bubble was going to burst, but did we know that hijacked commercial airliners were going to fly into skyscrapers to push confidence in the global economic future over the edge? We all knew the housing bubble wasn’t going to last forever, but how many of us knew that there was a demon lurking in the form of complex and obscure credit default swaps that threatened to the derail the global banking system?
The fact is that all the metrics in the world can only look backwards to predict forwards. The future takes us by surprise because it changes the rules of the game while were still looking backwards.
Just Ride the Wave
Years ago, I was approached by someone who wanted to buy one of my companies. At the time, my company had just made No. 247 on the Inc. 500. (Yes, there were only 500 companies on the Inc. list back then!) The dot-com bubble had not yet burst and the equities feeding frenzy was in full swing. The person who approached me was funded by ex-Wall Street bankers. One of them was perhaps the most widely known Wall Street personality of the 1980s.
When I met with him and his money managers, I was eager to understand how these brilliant financial minds would assess the health of the market. So I asked, “Why is the market so hot right now?” The response from one of the senior bankers on his team floored me: “I don’t pretend to understand it; I just ride it.”
I’m sure there was more to it. Perhaps he didn’t want to divulge the secret recipe to predicting the market. However, it’s more likely that the countless factors which contribute to any market swing, up or down, are far more complex than we can adequately factor into any simplistic analysis of one, three, or 30 variables.
The three indicators that I described tell us that we are trending up towards the inevitability of a significant correction. Some, like TMC to GDP, tell us it’s long overdue. Others, such as the VIX and Bond Yield Inversion, say that it’s not within the next 12-18 months. But all of this only factors in the known or knowable variables. Uncertainty is not and cannot be factored into any analysis.
I know, that’s not what you were looking for. You were hoping I’d provide some definitive answers. I’m not doling out financial advice. That’s not my forte. There are plenty of professionals who make a living doing that. You need to come to your own conclusions. Like you, I’m paying attention as best I can to as much as I can.
In the end, what I do know is what we all know: that every market cycle has an end. The one thing I can assure you of is that this one will be no different.