Authored by Lance Roberts via RealInvestmentAdvice.com,
“Don’t fight the Fed.” – Every amateur investor who has never seen a bear market.
Over the last decade, investors have been trained to “buy” the markets every time the Federal Reserve was engaging in providing liquidity to the financial markets. As I noted in “Pavlov’s Dogs:”
“Classical conditioning (also known as Pavlovian or respondent conditioning) refers to a learning procedure in which a potent stimulus (e.g. food) is paired with a previously neutral stimulus (e.g. a bell). What Pavlov discovered is that when the neutral stimulus was introduced, the dogs would begin to salivate in anticipation of the potent stimulus, even though it was not currently present. This learning process results from the psychological ‘pairing’ of the stimuli. Importantly, for conditioning to work, the ‘neutral stimulus,’ when introduced, must be followed by the ‘potent stimulus,’ for the ‘pairing’ to be completed.”
For investors, as each round of “Quantitative Easing” was the “neutral stimulus,” which was followed by the “potent stimulus” of higher stock prices, Not surprisingly, after a decade of “ringing the bell,” investors have been conditioned to respond accordingly.
It is worth a trip back through history to evaluate the relationship between the Fed’s monetary interventions, and the impact on asset prices.
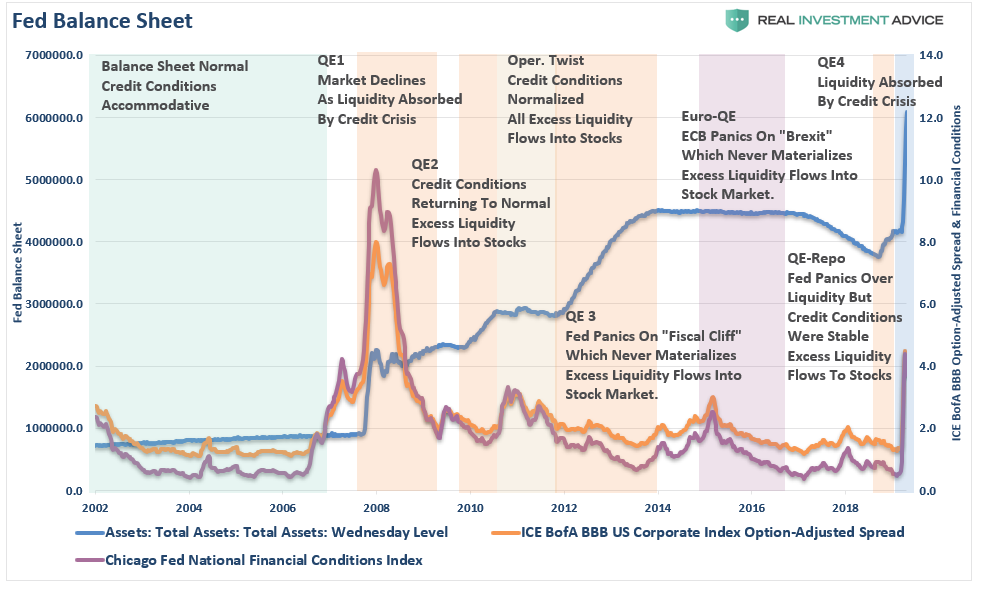
2002-2007: Credit spreads and financial conditions had normalized following the “Dot.com” crash. The Fed’s balance sheet was growing in line with the rate of GDP growth, ensuring banks had adequate liquidity to operate (This is the baseline of “normalcy.”)
2008: March – Bear Stearns fails, mortgage defaults start to rise, credit conditions worsen, and yield spreads rise. September – Lehman fails and freezes credit markets. Asset prices decline sharply, triggering margin calls, and the Fed floods the system with liquidity. As discussed last week:
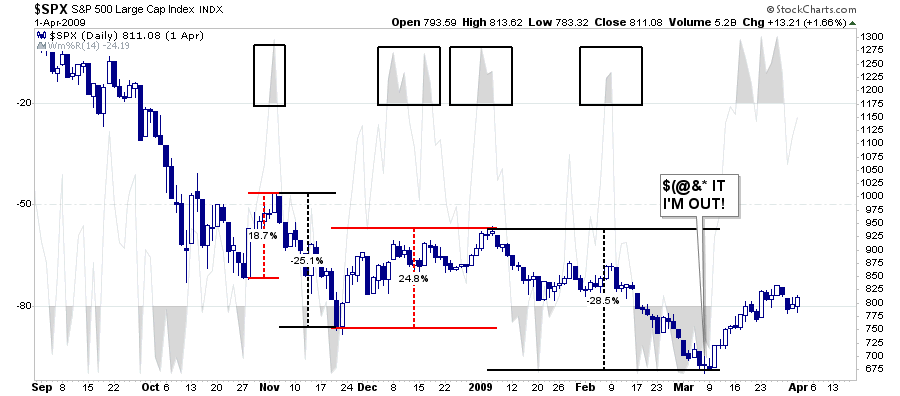
The reality of the economic devastation begins to set in as unemployment skyrockets, consumption and investment contract, and earnings fall nearly 100% from their previous peak, as the market declines 26% into late November. It was then the Federal Reserve launched the first round of Quantitative Easing.
Stocks staged an impressive rally of almost 25% from the lows. Yes, the bull market was back! Except that it wasn’t. Over the next few months, the Fed’s liquidity was absorbed by the “gaping economic wound,” and the market fell another 28.5% to its ultimate low.”
Note: At this juncture, credit conditions were improving, spreads were normalizing, and the bulk of the economic devastation had been seen.
2010: QE1 ends, credit conditions tighten slightly as the new economy recovery showed strains. The Fed quickly acts to inject more liquidity with QE2. Given credit spreads and conditions were close to normal levels, the excess liquidity only had one place to go – the stock market.
2011: QE2 ends as the world is hit with a double-threat. Japan is impacted by a massive tsunami and the U.S. Government is enthralled in the midst of a “debt-ceiling debate.” Again, despite credit spreads and conditions being near normal levels, the Fed jumps in with “Operation Twist.” The economy quickly found its footing in Q3 of 2010, and with no crisis to absorb the liquidity, it flowed into the stock market.
2012: One of the byproducts of the “debt ceiling debate” was a bipartisan commission tasked with finding $1 trillion in spending cuts to reduce the deficit. This was known as the “fiscal cliff.” In late 2012, Ben Bernanke panicked and launched QE3 to preempt a “fiscal cliff” crisis. However, no crisis occurred, leaving the trillion-plus in liquidity with nowhere to go but the stock market.
2016: With the market down 20% from the peak over fears of a disorderly “Brexit,” Janet Yellen calls on the BOE and ECB to launch a Euro-QE program. Once again, the “Brexit” crisis never happened, and the only place for all of the excess liquidity to go was into the equity markets.
2019: In mid-summer, the Fed is faced with an “overnight liquidity shortage” for hedge funds. This was the first sign of trouble, but credit markets were not showing any real signs of strain. With credit markets operating normally, the liquidity flowed into asset prices, pushing markets to all-time highs.
NOTE; With 2008 a distant memory, and a decade of “emergency measures” providing “excess liquidity” to financial institutions for “emergencies” that never occurred, investors were fully trained to “buy the dip.”
2020: COVID-19 Strikes: The shutdown of the economy was unprecedented. Importantly, for the first time in a decade, credit conditions tightened, and yield spreads blew out. Bank’s loan loss reserves are exploding, and the economic data is worse than at any other point in history outside of the “Great Depression.”
While the Federal Reserve is busy providing liquidity to keep the credit markets functioning, investors who have forgotten to study 2008 still assume stocks can only rise. However, this time, for the first time since the “Financial Crisis,” there is “credit event” absorbing the Fed’s liquidity.
Importantly, like 2008, the “economic disruption” is likely to be far worse and more damaging to corporate earnings, than currently estimated as these “bailouts” fail to increase economic prosperity, wages, or savings.
How do we know that?
The chart below is our economic composite indicator. Given the primary indicators of economic strength are wage growth, inflation, the dollar, and interest rates, it is no surprise the indicator has a close correlation to GDP.
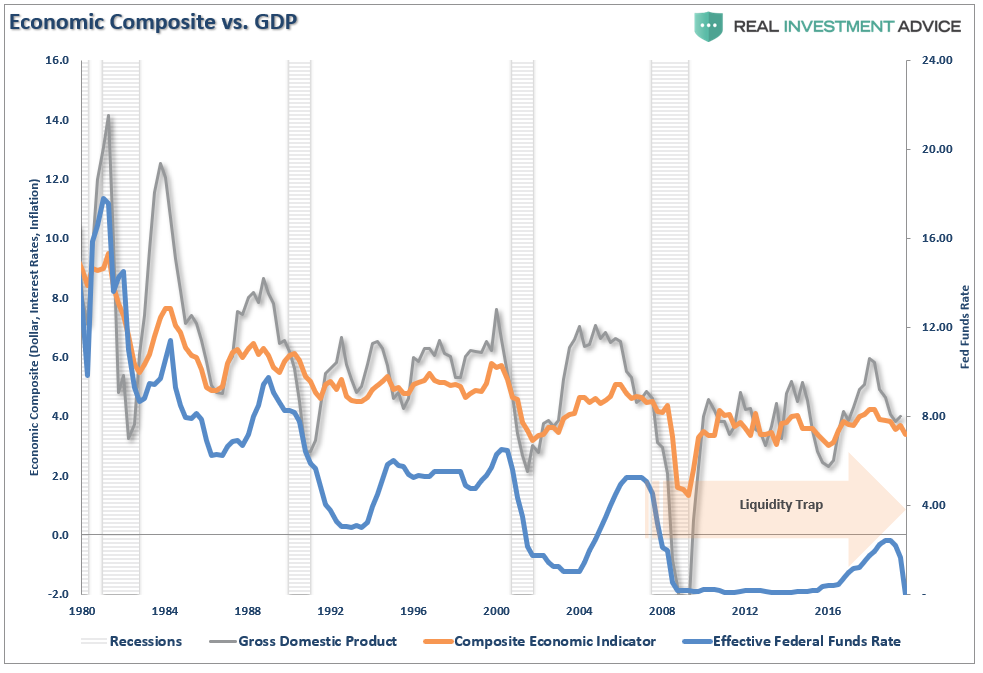
Since the financial crisis, there has been very little organic economic growth. Importantly, the rate of growth remained below pre-recessionary highs. The Fed’s zero-interest-rate policies, and expansion of the balance sheet, did little to improve that weakness. In fact, we argue that their incredibly loose monetary policy which fed speculative investments, deterred from economic growth.
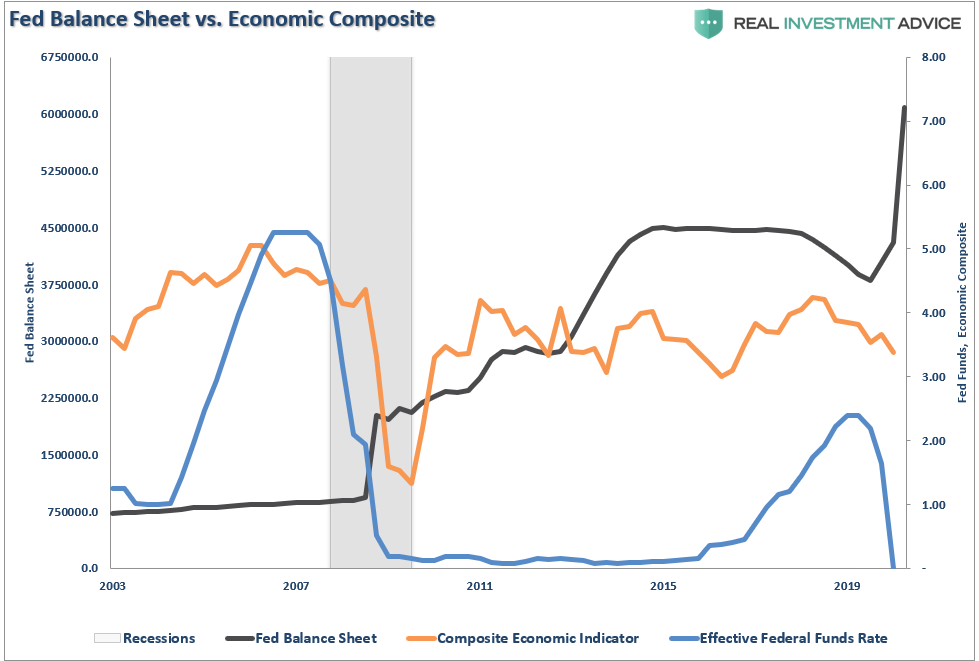
In other words, while the Federal Reserve’s policies have been shown to absolutely boost asset prices, and inflate debt levels, they are responsible for detracting from economic growth, and widening the “wealth gap” between economic participants,
No “V-Shaped” Recovery
Consumption, what you and I spend supporting our families, working, and playing, comprises roughly 70% of economic growth. Of that 70%, retail sales make up about 40%. This past week, the first “retail sales” report was released showing the impact of the “economic shutdown” on domestic consumption.
“Pretty Catastrophic’ Month for Retailers, and Now a Race to Survive. March brought a record sales plunge as the coronavirus outbreak closed stores. A long shutdown could leave lasting changes in the shopping landscape.” – NYT
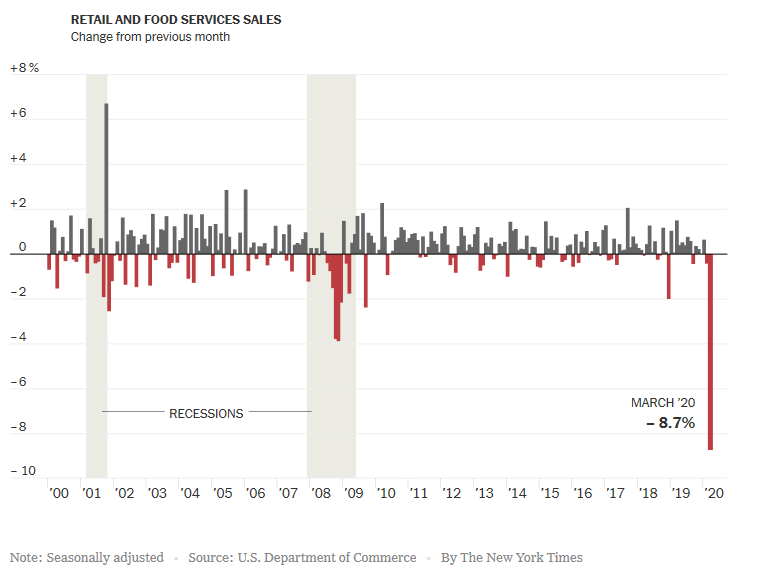
This decline in retail is not the end, but the beginning, as job losses mount. Retail demand is going to continue to suffer long after the “economy” is re-opened.
From this analysis, we can extrapolate the decline in retail sales into expectations for PCE growth. Again, since PCE comprises almost 70% of the economy, this is why expectations are for a drop of 10%, or more, in GDP in the second quarter.
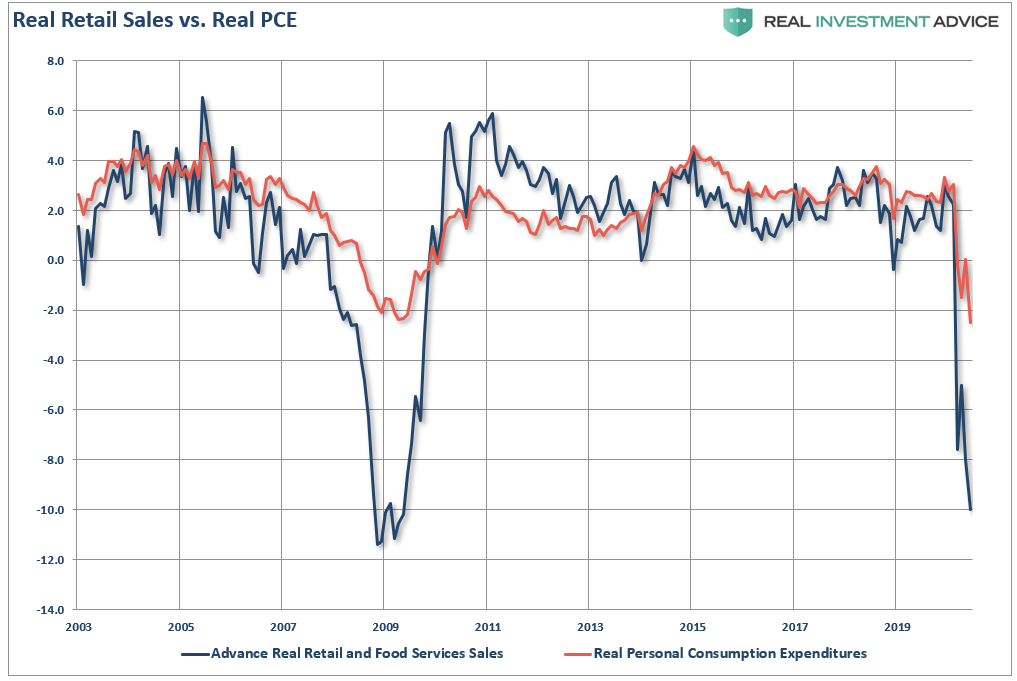
Unfortunately, despite many hopes to the contrary, this is unlikely to be a “V-shaped” recovery for several reasons.
While the Government is talking about re-opening the economy, they are discussing doing so in phases over several months. Essential workers like plumbers, electricians, and other providers will reopen first, and only in areas with low infection rates. Then over time the rest of the economy will be opened as the “risk of spread” diminishes.
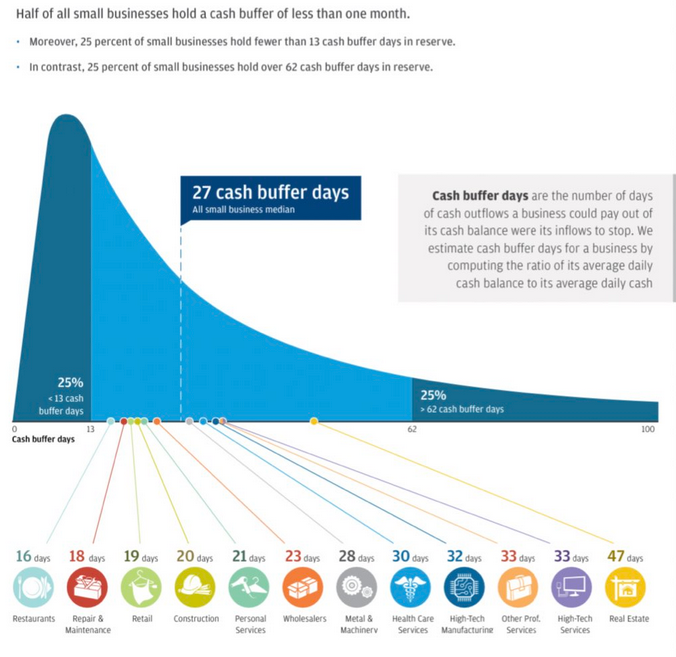
The problem is that during that time, the majority of small business owners, which as stated previously, comprise about 70% of employment, and roughly 45% of GDP, will run out of money. To wit:
“Most importantly, as shown below, the majority of businesses will run out of money long before SBA loans, or financial assistance, can be provided. This will lead to higher, and a longer-duration of, unemployment.”
However, the bigger problem was noted on Wednesday by UBS:
“Not every company that qualifies for the Federal Reserve’s loan support will survive the coronavirus-led downturn. Despite the Fed’s rescue efforts, these companies may struggle to remain in business and could be downgraded deeper into junk territory by the raters.
‘For now, we assume direct Fed loan support helps 50% of those eligible; i.e., distressed firms become non-distressed. However, without specific single name analysis, this estimate is effectively the coin toss because the actual figure is below 100% and above 0%. That implies half of eligible issuers avoid distress with Fed loans (9% leveraged loans, 10% middle-market, 19% high-yield).’
In reality, not every company that qualifies on paper will be able to pull this off. Some may suffer from long-term effects of the pandemic such as reduced travel and office-space rentals. Others may require assistance beyond September 30, which is the current termination date of the Fed’s facilities.”
Even if these companies get loans and assistance, they require “revenue” to stay in business. However, the nasty “feedback loop” is that by reducing employment, consumption is also curtailed. As revenue falls at the top line, the propensity to make capital investments into the economy plummets.
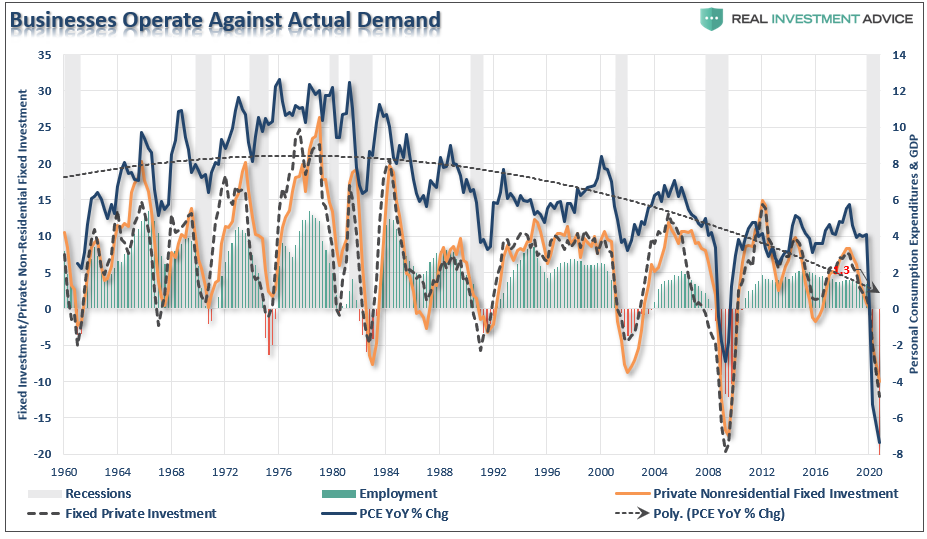
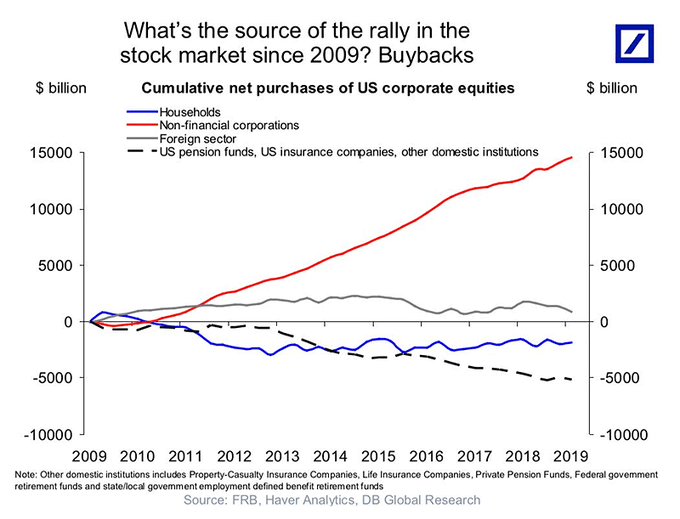
Of course, that demand drop also reduces the biggest support for asset prices over the past decade – share buybacks.
“Between the Federal Reserve injecting a massive amount of liquidity into the financial markets, and corporations buying back their own shares, there have been effectively no other real buyers in the market.”
The problem with surging unemployment is what happens to confidence.
Consumption Is Function Of A Paycheck
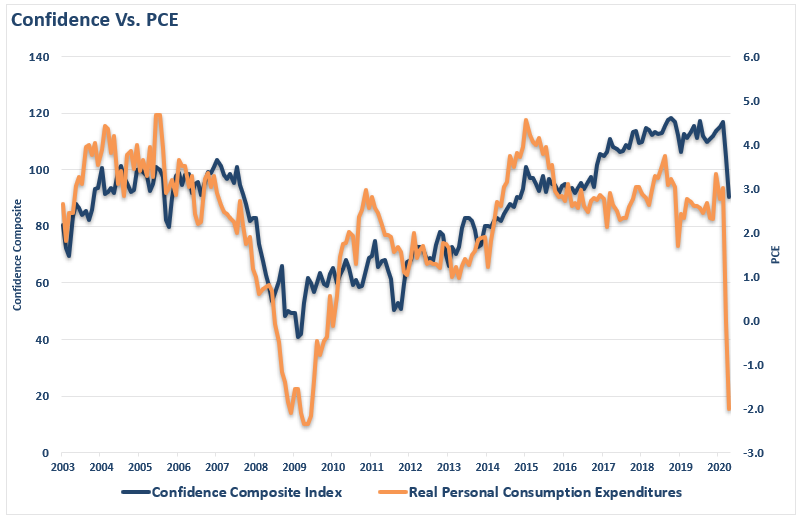
Without a job, or even the threat of losing one’s job or a pay cut, “confidence” is falling quickly which curtails consumption.
(The chart below shows our composite confidence index, which combines both the University of Michigan and Conference Board measures.) If we overlay that confidence composite with personal consumption expenditures, it is not surprising there is a reasonably high correlation.
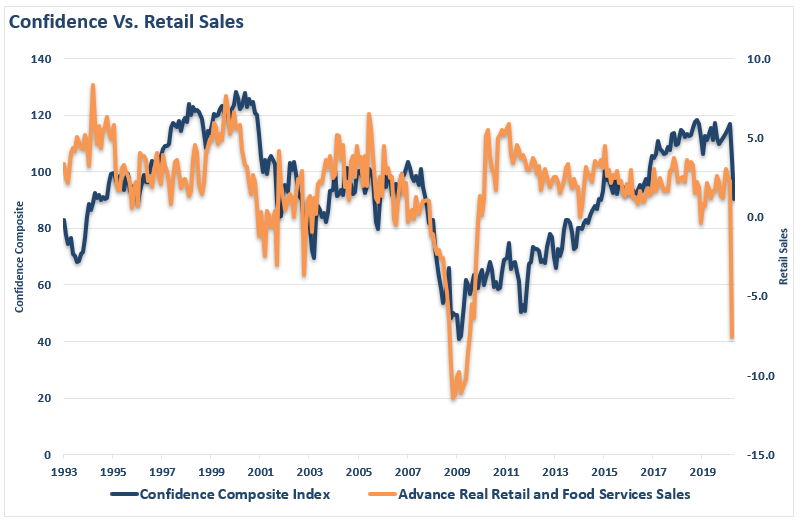
Not surprisingly, since retail sales make up 40% of personal consumption expenditures, it also has a high correlation with consumer confidence.
Do you know what else has a high correlation with consumer confidence?
Employment.
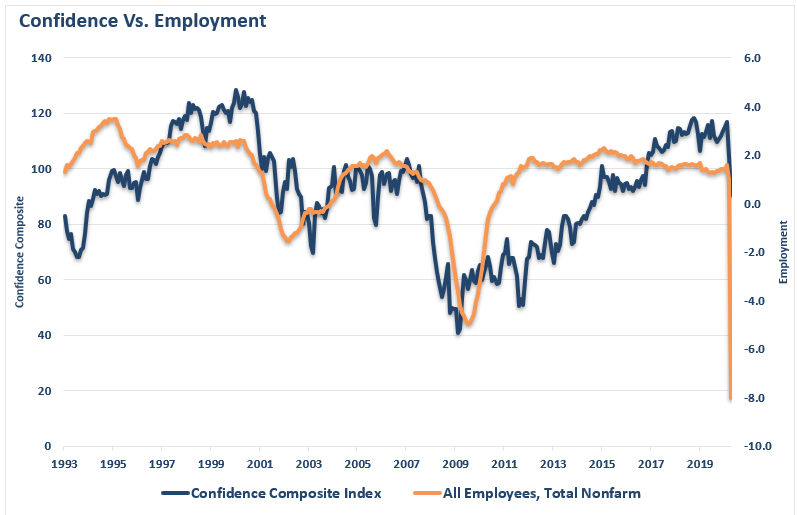
This should be a relatively obvious connection.
No job = No paycheck = No spending.
Of course, in October 2019, we asked a simple question:
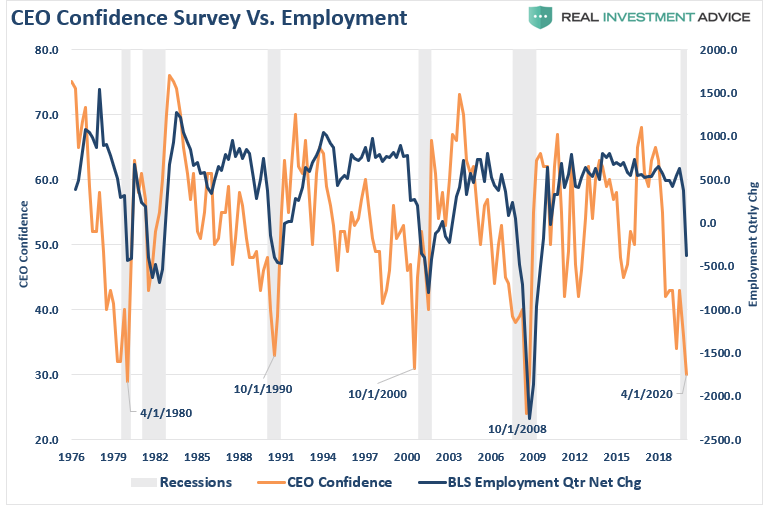
“[Who is a better measure of economic strength?] Is it the consumer cranking out work hours, raising a family, and trying to make ends meet? Or the CEO of a company who is watching sales, prices, managing inventory, dealing with collections, paying bills, and managing changes to the economic landscape on a daily basis? A quick look at history shows this level of disparity (between consumer and CEO confidence) is not unusual. It happens every time prior to the onset of a recession.

“Notice that CEO confidence leads consumer confidence by a wide margin. This lures bullish investors, and the media, into believing that CEO’s really don’t know what they are doing. Unfortunately, consumer confidence tends to crash as it catches up with what CEO’s were already telling them.
What were CEO’s telling consumers that crushed their confidence?
‘I’m sorry, we think you are really great, but I have to let you go.’”
As I concluded in that note last year:
“It is hard for consumers to remain ‘confident,’ and continue spending, when they have lost their source of income. This is why consumer confidence doesn’t ‘go gently into the night,’ but rather ‘screaming into the abyss.’”
While the markets have indeed managed a strong “bear market rally” following the fastest decline in the entirety of financial history, there are reasons to be cautious.
We are just entering into what will likely be a longer, deeper, and more damaging recession than what we saw in 2008. Credit conditions and yields spreads are still a long-way from normalized, and defaults and bankruptcies are likely only in the very early stages. Liquidity from the Fed has suspended bankruptcies for the time being, but the longer this recession/depression drags on, the greater the risk is the Fed only delayed the inevitable.
While the Federal Reserve has certainly moved quickly to assist the credit markets in remaining operational, as discussed here, those “emergency measures” don’t translate into stronger economic prosperity, revenues, or corporate profits.
What this all means is there will be no “V-shaped” recovery.
It also suggests there is a possibility that “buying the dip,” doesn’t work this time.