by John Mauldin
Recently I searched the Thoughts from the Frontline archives to see how often I used the word “bubble.” It was more than I thought, and I wasn’t quoting Don Ho. The bubbles I talked about were anything but tiny. Most of them subsequently popped, too.
Recently I searched the Thoughts from the Frontline archives to see how often I used the word “bubble.” It was more than I thought, and I wasn’t quoting Don Ho. The bubbles I talked about were anything but tiny. Most of them subsequently popped, too.
For most people, buying a home is the biggest single purchase they ever make. It continues to represent the largest part of their net worth. It is also the most leverage most people ever take on. The risk of loss is very high if you have little equity in the home and need to sell it.
Housing has other effects on the economy, too. Booming home values contribute to a “wealth effect” that increases consumer confidence, making people spend more freely. Some homeowners tap their equity to finance other purchases. Some of it finds its way into the stock market. The industries that feed on all this—construction, building materials, mortgages, title companies, real estate agents, etc.—are huge employers.
All of which says the housing sector is far more important than many realize. They notice only when it falls apart. Today home prices are being compared to the pre-2008 period, which was clearly a bubble that ended painfully for many. Are we setting up for the same again?
I don’t think so. Yes, the housing market is a bit overheated, but for reasons that make far more sense than the rationalizations of stock market bulls. Some buyers are certainly overpaying and may regret it. Nonetheless, I don’t foresee another 2008-style housing crash in the near future, nor anything like the subprime crisis. There are altogether different fundamentals working here.
Manic Behavior
Let’s start with the obvious: The single-family home market is crazy hot right now. Many Americans want to relocate, for various reasons, and they outnumber the quantity of homes for sale. No surprise, the market responds with higher prices—sometimes far higher than seems justifiable.
On the other hand, basic economics says the “fair” price is the intersection of the amount the marginal buyer is willing to pay, and the amount the seller is willing to accept. Whatever the rest of us think isn’t part of that equation. It is somewhat murkier in housing because every product is one of a kind, based on its location, size, condition, and so on. Houses aren’t like shares of a company’s stock, all of which have identical characteristics and thus identical value.
But in the current atmosphere, some houses are selling in a kind of frenzy that resembles a crazy day in the stock market. Here’s one example, via Business Insider.
A California home received 122 offers in a single weekend amid a skyrocketing US real estate market.
The 1,400-square-foot home—located in Citrus Heights, California, a suburb of Sacramento—was listed at $399,900. It spans 1,400 square feet and has three bedrooms, two bathrooms, and a swimming pool, according to a report from KTXL, the local Fox affiliate.
The house received 122 offers in two days, including one above $500,000, and has since been sold for an undisclosed amount—KTXL reports the selling price was “in the mid-$400,000 range.”
If you’ve ever sold your home and waited weeks (I’ve had to wait months before) to get even one offer, the thought of 122 offers in two days is hard to process. I would probably be kicking myself for not asking even more. But this is happening all over the US.
The pandemic and its associated fear triggered a frenzy, at first with wealthy city-dwellers wanting to get away from the same crowds that attracted them to urban life. Then, as companies let more of their staff work from home, people realized they could now live far from the office, in whatever location suited their desires. So, we have a kind of giant card-shuffling underway as millions reorganize their lives.
This will end, but for now it’s a flurry of activity. Some people are making mistakes in their haste. They buy houses requiring unanticipated repairs, or they move someplace that seemed nice then find it lacks what they wanted. That is unfortunately what happens when you get in a hurry. It’s unpleasant and maybe expensive for those affected, but the systemic effects probably aren’t great. Damage to the person who overpaid is offset by extra spending from the seller who got a windfall.
The bigger problem occurs when this activity sets up a price correction big enough to trigger a “negative wealth effect” that reduces consumer spending. Is that likely? Dave Rosenberg thinks so. These charts are from his March 31 morning letter.
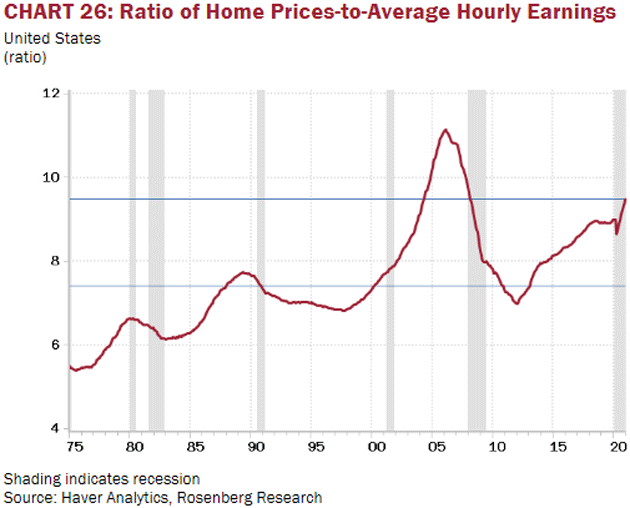
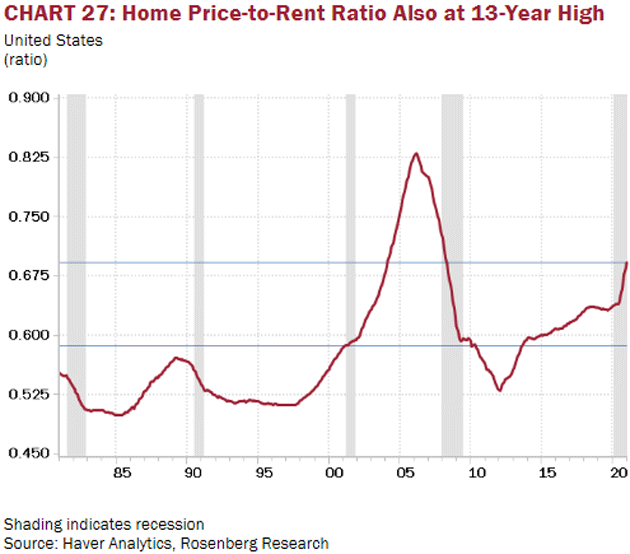
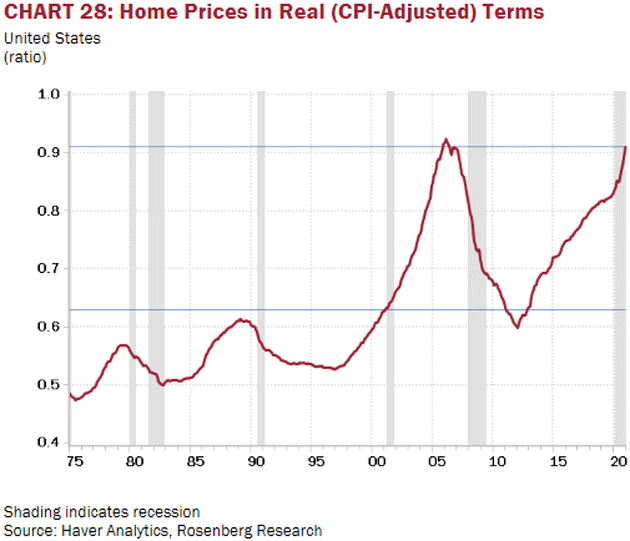
Source: Haver Analytics & Rosenberg Research
Dave notes that all ratios are mean-reverting, and extremes like these tend not to continue. He went on:
If the home price to CPI, to rent and to wage ratios ever did mean revert, which Bob Farrell’s Rule #1 says they will, we would be talking about a 20% decline in average home prices nationwide. Maybe the catalyst will come from bond yields to mortgage rates, as was the case the last time around. Remember—the home price erosion was happening as oil prices made their move above $100 per barrel and were on the way to a $150 per barrel peak. You tell me which of the two price movements exerted a more dramatic and lasting impact on the economy, inflation, and the markets.
The US household sector is exposed to residential real estate to the tune of $32 trillion. Tracing through the negative wealth effect on spending would shave $400 billion, or close to 3%, from consumption right there (and cut by half the stimulus right now being directed to the personal sector—the thing is, any mean-reversion here on residential real estate would have far more lasting effects than the short-term fiscal relief, which has little more than a three-month shelf life).
Is that kind of price correction likely? Maybe. But there’s more to this story. And while I agree that mean reversion is a real phenomenon, the data that we are going to examine suggests it may take quite some time for that mean reversion to come about, and may not be as dramatic as if it were all that happened in 2021/22.
Shrinking Inventory
When I write about specialized topics like real estate, I look for experts. Fortunately, I know quite a few of them, and no one knows more about housing and mortgages than Barry and Dan Habib of MBS Highway. (Definitely check it out if you are in that industry.) I first met Barry around 2006, and he became part of my regular New York dinner crowd. And he quickly became my go-to source on housing market questions. He is a three-time winner of the Zillow/Pulsenomics Crystal Ball, awarded to the most accurate real estate trend forecaster, with three out of the last five years and the last two in a row. Barry and Dan know this market cold.
So, this week we had a phone call, which turned into a Zoom call so we could go through a dizzying array of charts. The amount of data they track is staggering. Even more impressive is the way they can distill it into useful conclusions.
The bottom line is this: Looking at big-picture supply and demand factors, this housing bubble isn’t a bubble at all. Yes, it’s overheated in some places, but housing trends move in slow-motion compared to stocks. That makes it critical to look at long-term data and ignore the monthly/quarterly noise.
The first thing Barry explained is that housing “supply” isn’t the number of houses, but the number of houses for sale. When that number is low relative to the number of prospective buyers, prices rise.
You might think the US, being a dynamic if slow-growing economy the last decade, would have plenty of homes available. Not so. Inventory has actually been dropping for years.
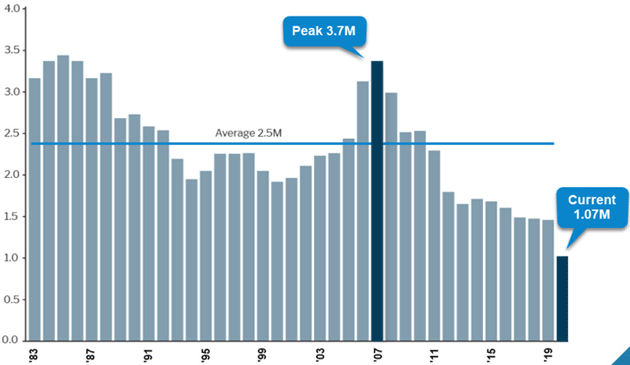
Source: MBS Highway
The single-family home for sale inventory peaked in 2007 and has fallen sharply since then, despite a growing population and economy. Other things being equal, that alone would probably push prices much higher. But all else wasn’t equal. In early 2020 the world went upside down as the pandemic struck and much of the economy came to a near standstill. In many places, that included home construction.
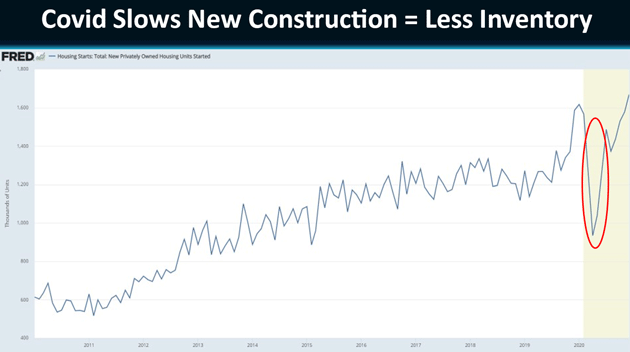
Source: MBS Highway
This wasn’t just because shutdown orders made contractors stop work. Even in places where construction continued, material and labor shortages slowed progress. The industry, which was already operating at a slower pace than in the past, basically lost about six months’ worth of production in 2020. Higher existing home listings simply couldn’t replace that lost inventory.
Material shortages were a factor, too, particular lumber. Back when I was younger and actually did work around the home, I remember buying plywood sheets for under $10. It was still in that range as recently as 2018. Last Saturday a friend was telling me about expanding his garage in New Orleans. He is paying $87.50 for a 4 x 8 sheet of 5/8 inch plywood. Ouch! He says it has now become the Garage Mahal.
Lumber prices have tripled from just a few years ago, if you can get it. This all pushes construction costs higher, which further reduces supply.
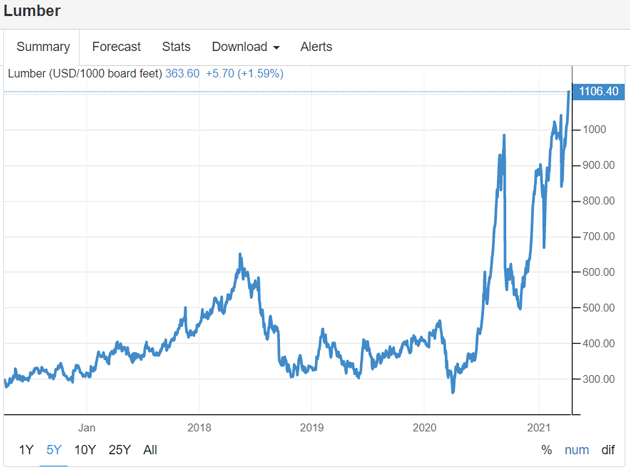
Source: Trading Economics
So, the supply part of the equation was already tilted and the pandemic made it more so. That’s why those ratios in Dave Rosenberg’s charts above were rising so steadily in recent years. Prices should rise if supply contracts, as long as demand remains at least steady.
But demand hasn’t been steady. It is booming. And it’s not just the pandemic.
Millennial Demand
The key factor in housing demand is household formation. Single people tend to live in apartments or rental homes. They turn into homebuyers when they think about having children, because they need more space and stability.
The age at which this happens has been remarkably steady around 33. See the pink line in this chart from Bloomberg.
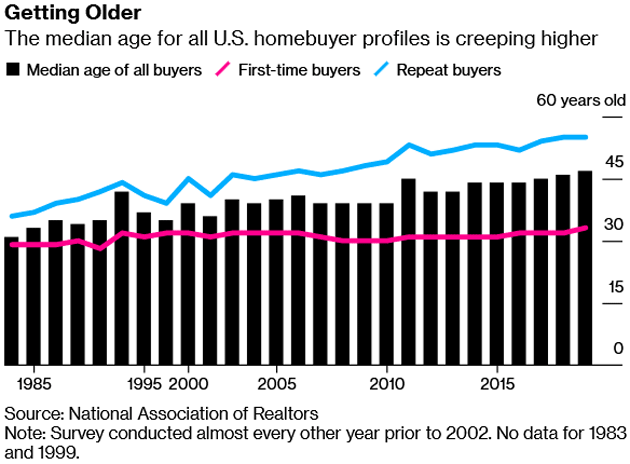
Source: Bloomberg
As Barry and Dan Habib point out, this means the number of 33-year-old Americans is crucial to housing demand, particularly at the less-expensive starter home end of the market. More people of that age mean more homebuyers, and vice versa. Of course, they have a chart to prove it.
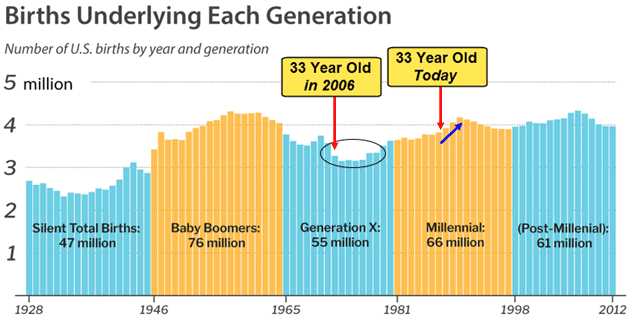
Source: MBS Highway
In other words, to gauge housing demand in any given year, look at birth rates 33 years earlier. As the chart shows, the number of births fell quite a bit for several years beginning in 1973. That meant fewer 33-year-old first-time homebuyers in 2006 and several years afterward. It is not coincidence the housing market ran into trouble about that time, though other factors (like easy credit for people who wanted to flip houses) contributed as well.
Today we have a different situation. Those who are 33 now were born in 1987 and 1988. At that point, births had been rising since the 1970s low and would accelerate further for a few more years. That’s why the last few years saw heavy demand from first-time buyers, and why it should continue a while longer. If you look at the graph you can see there’s another three or four years of rising demographics, then a fairly slow decline.
Now add to this the retiring Baby Boomers who also want smaller homes as they enter downsizing mode. As I wrote earlier, many people are looking to move to different locations as they are able to work from home much of the time. We have sharply rising demand combined with sharply lower supply. Of course, home prices have been rising. They can hardly do otherwise.
But can the Millennials afford houses without higher wages? Barry had a point there, too. It’s really simple math. Say home prices rise 10% and wages rise only 2%. Houses are now less affordable, right? Not exactly. The key is that your house payment isn’t your entire income.
Say you are considering a home purchase and the mortgage payment will be $1,000. Your monthly income is $5,000. That’s 20% of your income, which is fairly typical.
If the home price is 10% higher and mortgage rates stay the same, the payment would go up to $1,100. If your wages rise 2%, you would be making $5,100 a month. Your income rose enough to pay for the higher-priced home. Houses can stay affordable even if wages rise more slowly than home prices. Not indefinitely so, but for a while.
Now, we may have a problem if mortgage rates keep rising, as they have recently.
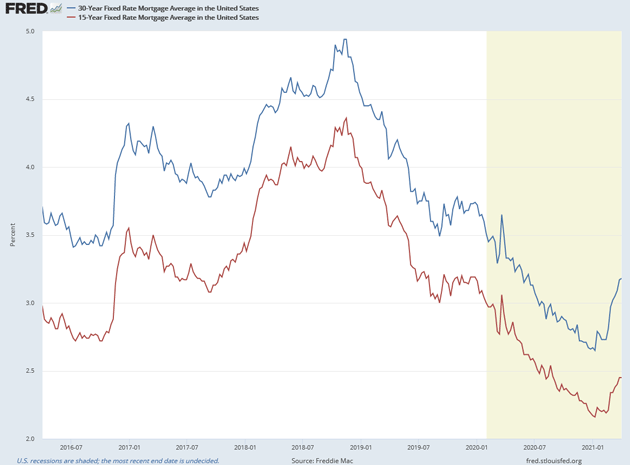
Source: FRED
This is a potential problem for housing. But it depends on Treasury yields, which I feel relatively confident that the Federal Reserve will not allow to rise much more. What exactly they will do is anyone’s guess. Some kind of yield curve control is a good bet as the federal debt spirals higher. It will likely come in the form of more quantitative easing and an Operation Twist situation where they start buying longer-dated bonds. They have little choice.
Intended or not, the policies that bail out our government should also serve to cap mortgage rates at historically low levels. That’s another bullish factor for home prices.
All that to say, housing may look like a bubble, but it’s only a tiny one. Our real problems are elsewhere.
Some Thoughts on Inflation
In the middle of our conversation on housing, Barry, Dan, and I began to talk about the effects of inflation on mortgage rates. I have noted before that the comparisons from one year ago beginning in March/April will make “headline inflation” appear to be soaring in the next few months. That is because we had very low inflation this time last year, and prices are rising on many items across the board. Barry agreed and showed me his own estimated inflation chart.
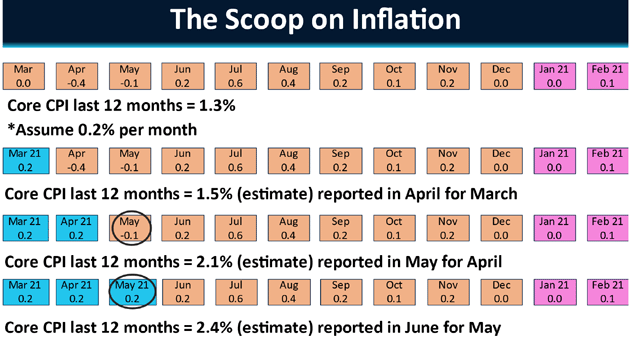
Source: MBS Highway
Note that annual core inflation was just 1.3% a few months ago. Inflation is roughly rising 0.2% a month, which is a reasonable base assumption. If that is the case, we should see 1.5% inflation in March (reported in April). But it will quickly rise to 2.1% and then 2.4% in April and May, at that relatively benign 0.2% assumption.
I have smart and talented friends who believe the base assumption should be higher for the next six months. I would not be surprised to see a 3% inflation number. Jerome Powell and other Federal Reserve officials will tell us the number is transitory, and I would generally agree. As we go back to normal, as supply chains actually get fixed, I expect the inflation numbers to go down. Further, one year from now the comparisons will be from a much higher base so it is likely that inflation will once again be below 2%.
For whatever reason, and I think it’s a silly reason, the Federal Reserve wants to keep rates low until we get back to 3.5% unemployment. That is a number we have only seen twice in the past 60 years, once during the Vietnam War when we had half a million soldiers out of the workforce and again at the end of 2019. Try as I might, I cannot see the linkage between financial repression with low rates and the unemployment rate again reaching an all-time low. I would much rather have stable pricing and some actual coupon return on my bond investments.
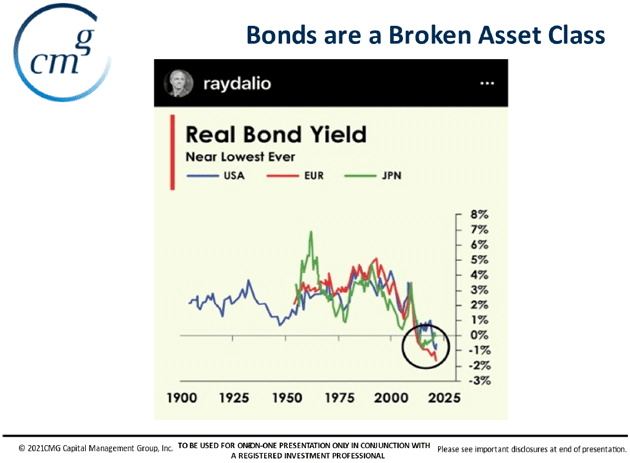
The standard 60/40 (stocks to bonds) portfolio is broken because bonds are broken. Look at this chart from Ray Dalio courtesy of my friend Steve Blumenthal of CMG. We literally have negative real rates in the bond markets and many institutional bond funds. The bond part of the 60/40 strategy was supposed to reduce volatility and provide income. When rates are rising it’s actually costing you money. If you own a 10-year Treasury fund, you are down about 6% this year. At a 1.7% yield, it will take the over three years just to get back to breakeven and that’s assuming that yields don’t rise even more. Bonds are not providing either the income nor the volatility hedge. Traditional passive 60/40 investing is dead.
There are places you can find income in the private markets, but those don’t show up in ETFs or mutual funds. There are reasonably good funds with trading strategies that produce bond-like characteristics. Again, not the traditional choice for most investment advisors.
Source: Steve Blumenthal
The Federal Reserve is forcing investors to move out the risk curve to generate income from their portfolios that they spent decades accumulating, hoping for enough to live on. For Boomers and people looking to retire in the next 10 years, this is an absolutely insane policy. But that is a topic for another letter and for the upcoming SIC.