by eyeball1234
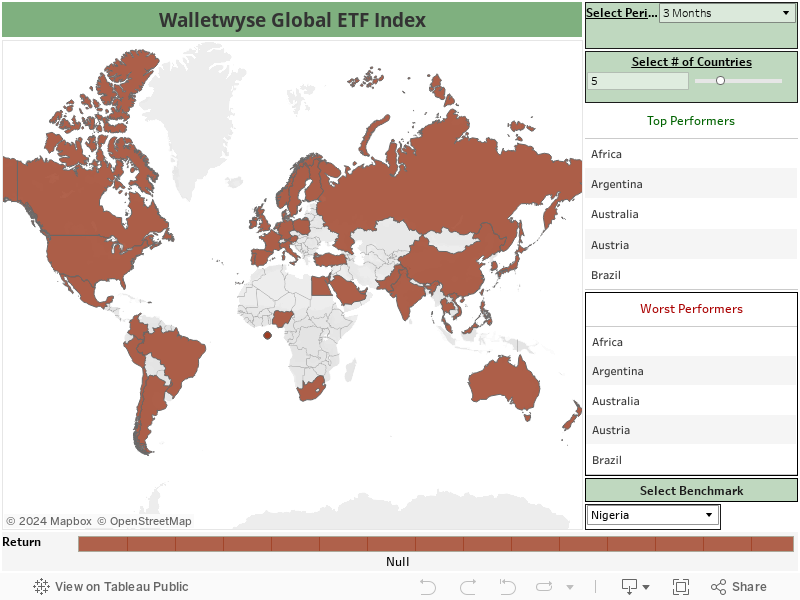
The inspiration from this viz came after seeing a video on Youtube about saving for retirement (don’t remember the name). The narrator, a guy who was probably in his late 50’s or 60’s, was talking about how exciting it was that “young people” could diversify their retirement portfolios by invest in other countries’ economies using exchange traded funds. I was kind of tickled by his enthusiasm, and after pulling data on historical ETF returns, decided it would be visually interesting to show the dramatically different ROI earned by funds that invest in different countries around the world.
The visualization allows you to select a 3 month, 1 year, 2 year or 5 year timeline. I’ve included all countries with a reliable fund available and used APIs to ensure the information is up-to-date.
Data source: Iextrading.com
Tool used: Tableau Desktop