by howmuch
Winter is the season for sleigh rides, chestnuts roasting on an open fire–and lots of holiday shopping. Holiday spending in November and December has seen a dramatic upswing since the 2008 recession. But how does spending for the winter holidays like Christmas stack up against spending for other holidays and events throughout the year? That’s the subject of our latest visualization.

Use this visualization
- The winter holidays are the most expensive time of the year and 63% of Americans feel the pressure to overspend.
- In 2018, Americans collectively spent $6.2 billion on Black Friday and $7.9 billion on Cyber Monday alone.
- Retail sales in November and December are projected to increase between 3.8 percent and 4.2 percent in 2019, reaching between $727.9 billion and $730.7 billion.
- Compared to 2018, most major holidays throughout the year saw an increase in spending per consumer in 2019. The exceptions were Halloween (decrease from $86.79 to $86.27) and Independence Day (decrease from $75.35 to $73.33).
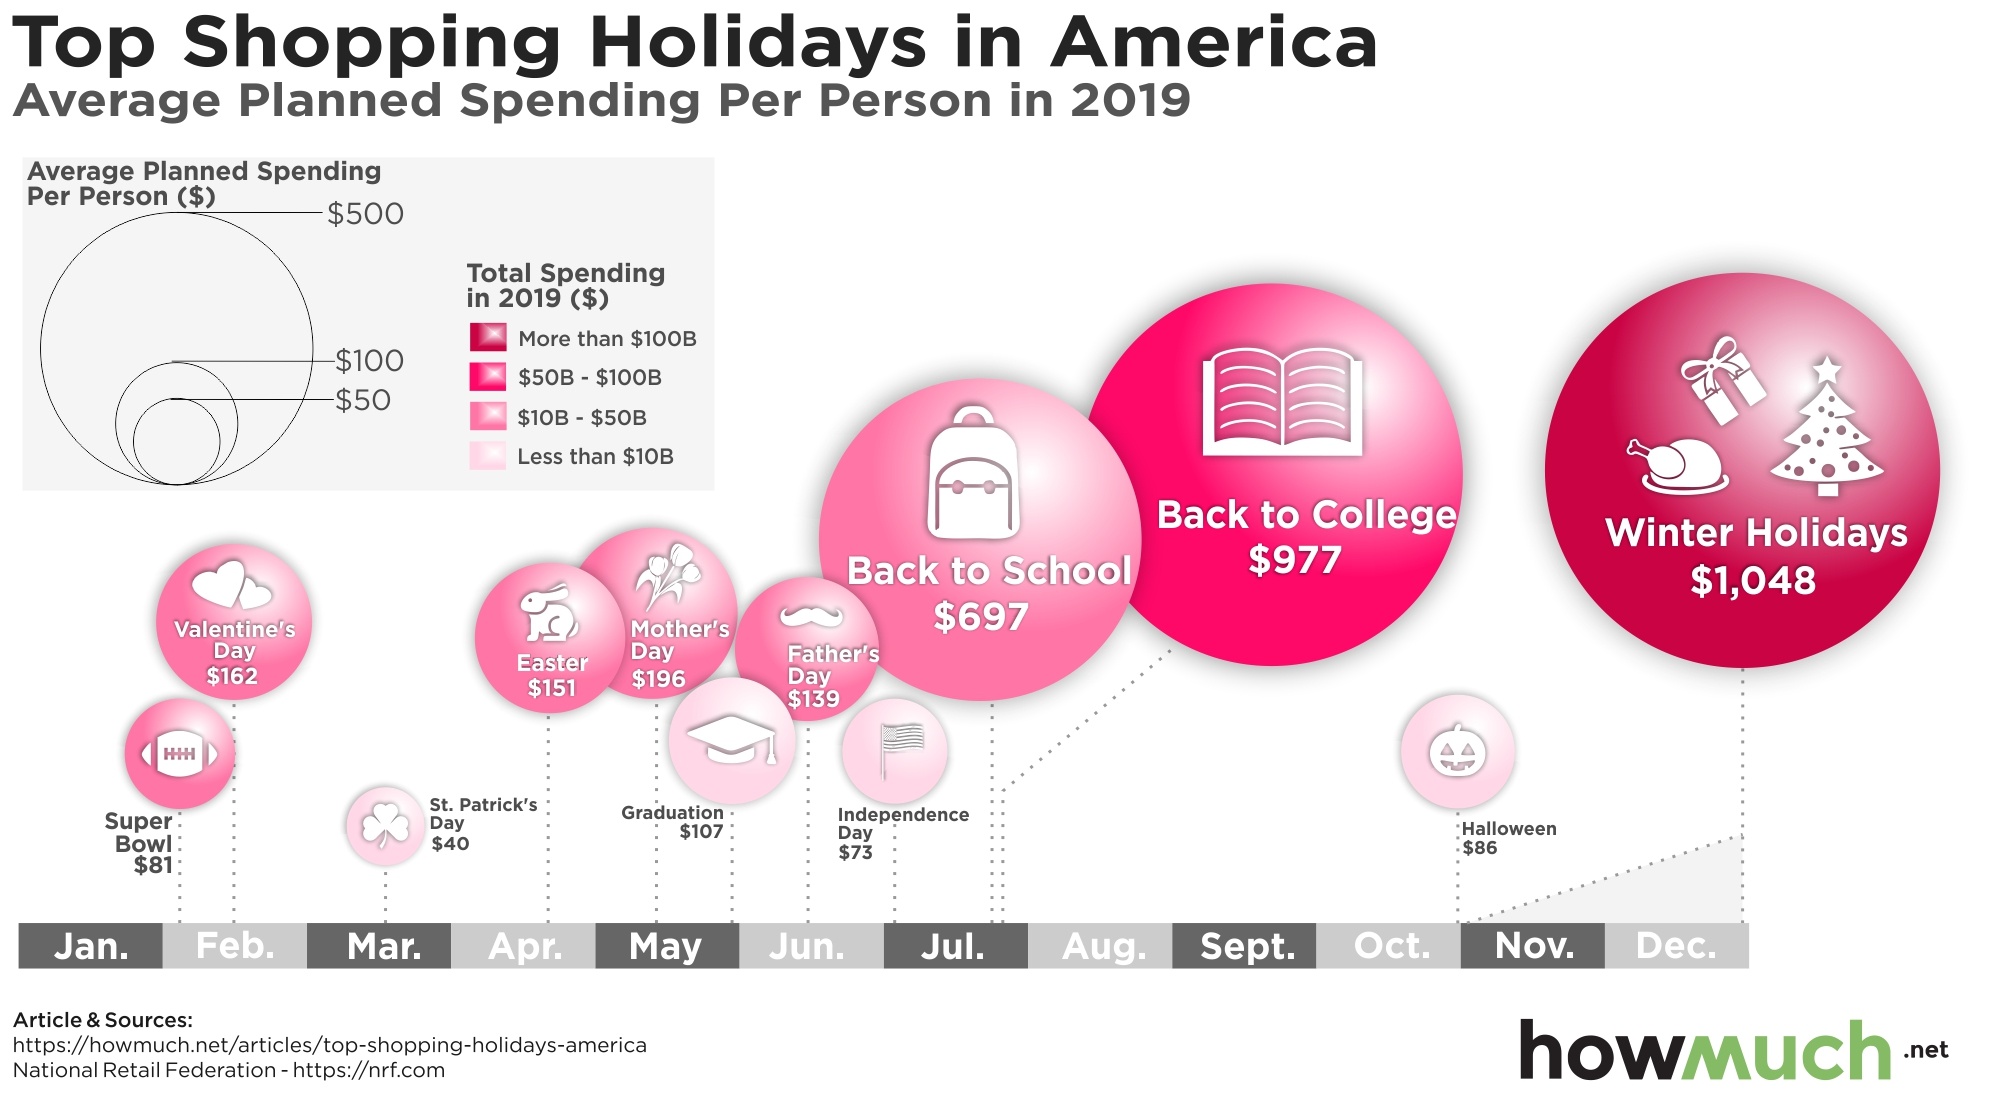
The data for this visualization came from the National Retail Federation’s report on retail holiday and seasonal trends, which compiles information about consumer spending for major American holidays and events. Our visualization maps out these holidays on an annual timeline (from January through December), with large pink circles floating above the timeline to represent each holiday. To show consumer spending at the individual level, in each holiday’s circle we included the American consumer’s average planned spending (2019). The size of the circle also correlates to the comparative amount of consumer spending, with larger circles indicating higher average expenditures. To show consumer spending at the aggregate level, each circle is also color-coded with a different shade of pink; the darker the shade, the more consumer spending on the national scale.
Top 10 Events by Average Planned Spending
1. Winter Holidays: $1,048
2. Back to College: $977
3. Back to School: $697
4. Mother’s Day: $196
5. Valentine’s Day: $162
6. Easter: $151
7. Father’s Day: $139
8. Graduation: $107
9. Halloween: $86
10. Super Bowl: $81
In general, the winter holidays and back-to-school days see the most consumer spending at both the individual and national levels. Notably, the winter holidays also span the longest time frame, from November 1st to December 31st, while most of the other events and holidays on the timeline last for only one day and tend to have shorter seasons for sales.
Another major factor contributing to the high amount of spending during the winter holidays is the popularity of Black Friday and Cyber Monday. Contrary to popular belief, Black Friday is bad for business. Profits tend to be fairly low for companies on Black Friday since prices drop significantly, while operating costs (employee pay, etc) increase. In addition, Black Friday is more likely to attract “low-value” customers who only shop at the retailer due to the sale, rather than become a repeat, “high-value” customer. Since Thanksgiving is happening so late this year and the shopping period between Thanksgiving and Christmas will be shorter, it will be interesting to see if sales numbers change from the NRF’s 2019 projections.
Do you notice your spending habits change during the holidays? What’s on your wish list this holiday season? Please let us know in the comments.