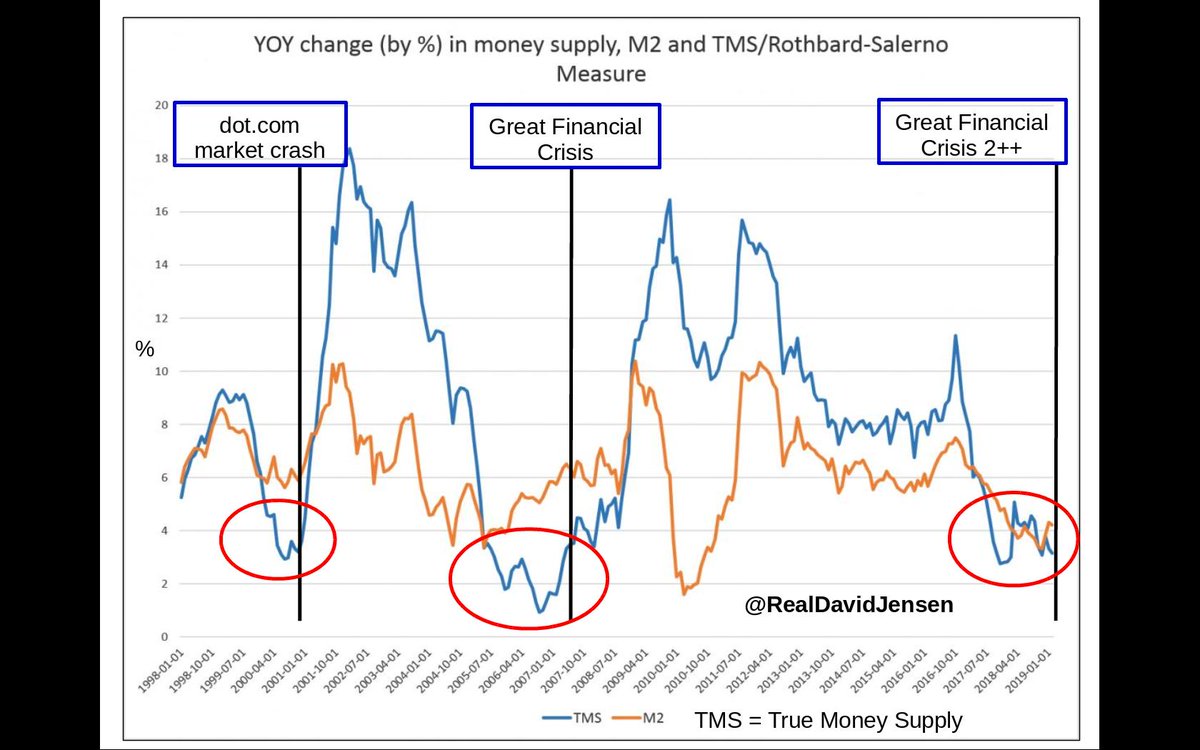
via @RealDavidJensen:
It is on – that is the bottom line.
#Fed suddenly cut the Money Supply (TMS) in 2017 just like 2000 & 2007 & now the crash begins after 1 – 2 yrs.
GDP, PMI, Inventories, dropping Treasury yields, etc. just lagging indicators.
#markets #Finance #fx #EndTheFed

Not just #bond yields caving.
2,000 share NYSE Composite let go in Jan 2018 (~ 12 months after #Fed slashed Money Supply (TMS) to pre-crash yr 2000 & 2007 levels) yet no talking heads recognize lower highs & lower lows.
#markets #Finance #fx #EndTheFed #stocks #gold #OOTT

3mo-10yr spread collapses (worse when adjusted for QE). Hwvr, bond yields a LAGGING indicator to Money Supply (TMS) – & TMS now chopped to yr 2000 & 2007 mkt collapse levels. Disloc’n follows. https://www.zerohedge.com/news/2019-05-29/yield-curve-collapse-continues-morgan-stanley-its-much-worse-you-think … #Bonds #markets #Finance #fx #EndTheFed #stocks #gold #OOTT

… the 3-Mo Treasury yield has broken down thru its 200 dma.
1) Fed cuts money supply (TMS) ✔️
2) 3-Mo Tsy breaks 200 dma ✔️
3) Stock market breaks down (2000, 2008) …
#Bonds #markets #Finance #fx #EndTheFed #stocks

Last two times the #Fed heavily cut the Money Supply (yrs 2000 & 2006/2007), 3-month Tsy’s plunged below the 200 dma then S&P500 collapsed. The Fed has again cut Money Supply & 3-month Tsy’s also about to break 200 dma. https://themarketear.com/posts/c2K0iVcHD7 … @SamanthaLaDuc #gold #fx #bonds

via @OccupyWisdom
1/
– China trade deal not resolved
– Over 7,000 store closings so far this year
– More companies trading at 52 week lows than 52 week highs
– Manufacturing activity at 9 year low
– US new housing at 5 month low
– GDP forecasts down
– Inverted yield curve
2/
– BREXIT still unresolved
– International growth slow
– Eurozone manufacturing contracting
– German business confidence at 4 year low
– South Korea exports declining
– Debt ceiling end of summer
HT @FrankCurzio