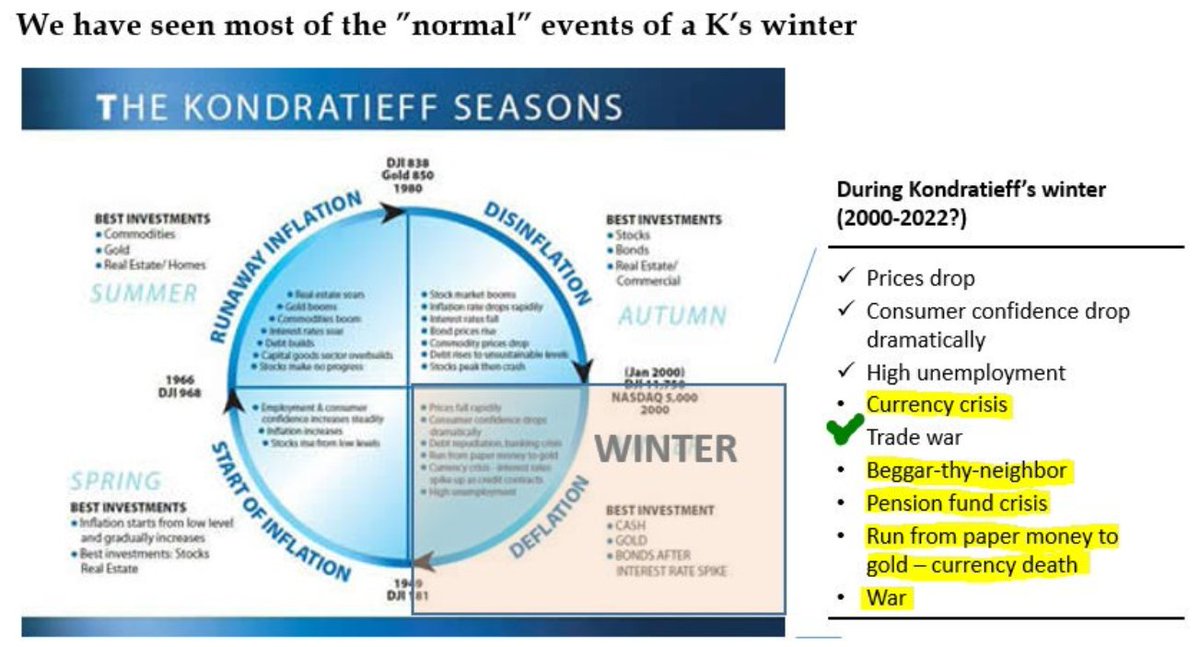
via @HenrikZeberg:
“#Deflation” or “#Disinflation” have been my call for a long time. We are not out of Kondratiev’s winter yet. We haven’t seen the all events which unfold during K’s winter. Still to come Pension Funds Crisis, Currency Crisis, Run from Paper Money …and War #HZupdates
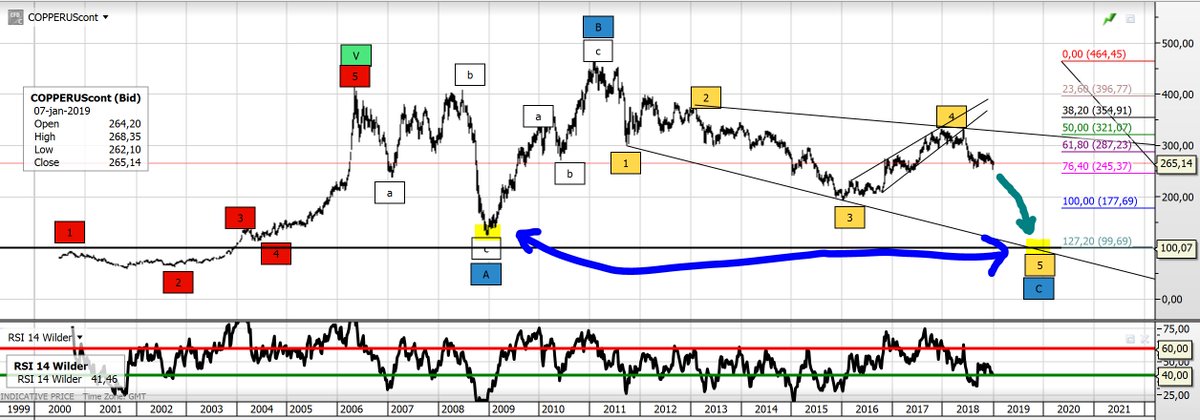
And “#Deflation” outlook is clear in the charts imo. I look primarily to #AUDUSD and #Copper for guidance. Observe this chart of #Copper. Major ABC pattern. Length of C can be set by the irregular pattern indicating low in Copper below 2008-levels = deflation in 2019 #HZupdates
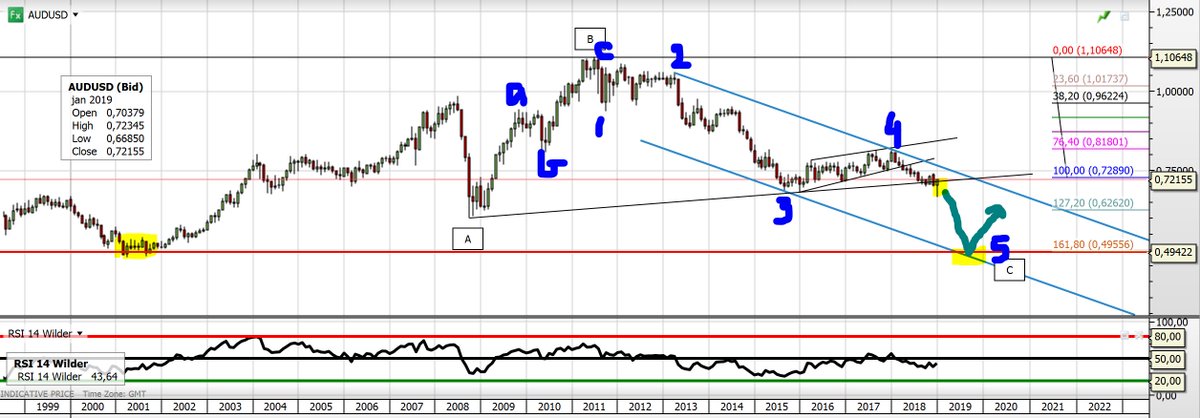
#AUDUSD is also an inflation gauge. Same ABC-pattern. Notice, how price flirts with trendline from 2008. Small bounce – but when trend continues, I expect it to be strong and target ~0.5. This is #Deflationary and all markets must be observed through this perspective #HZupdates
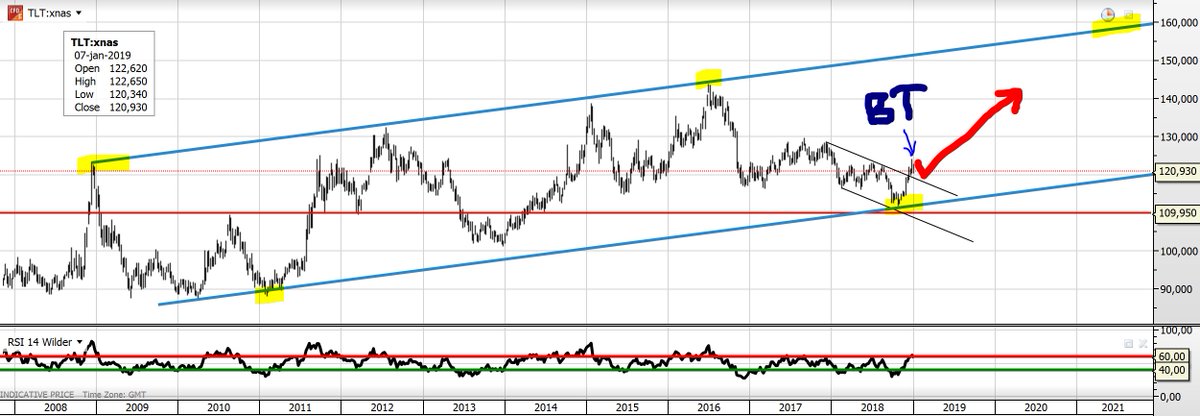
What does well during #deflation? #TLT! Remember the calls of ATL in yields among large hedge fund managers? Think again! This last phase in K’s winter will take us a lot lower in yields. In fact, I think we are stand right in front of a larger drop in yields. #HZupdates

In #TLT chart we have seen a rally off the bottom LT-trend line – breaking ST-trend channel – which is now Back-tested (BT). This is what creates the enthusiasm and cheers in the #equity market. But – we are in RISK OFF environment. Soon #TLT will take off towards >150 #HZupdates
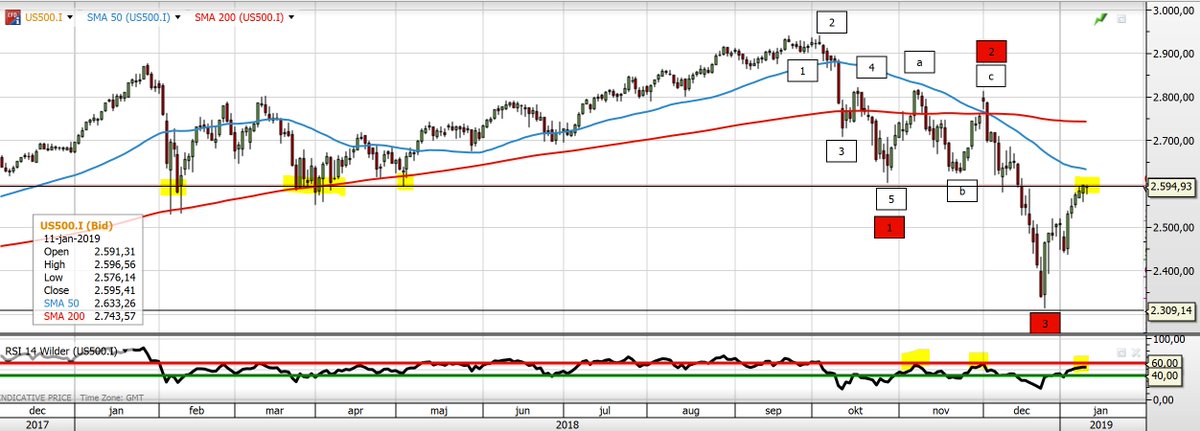
We are in Risk-Off environment. But Bear markets have some of the strongest rallies in #equities. This is also case in this Major Bear market. #SP500 meeting strong resistance area. RSI hasn’t been able to retake levels >60 since Oct. top. This Bear is far from done #HZupdates
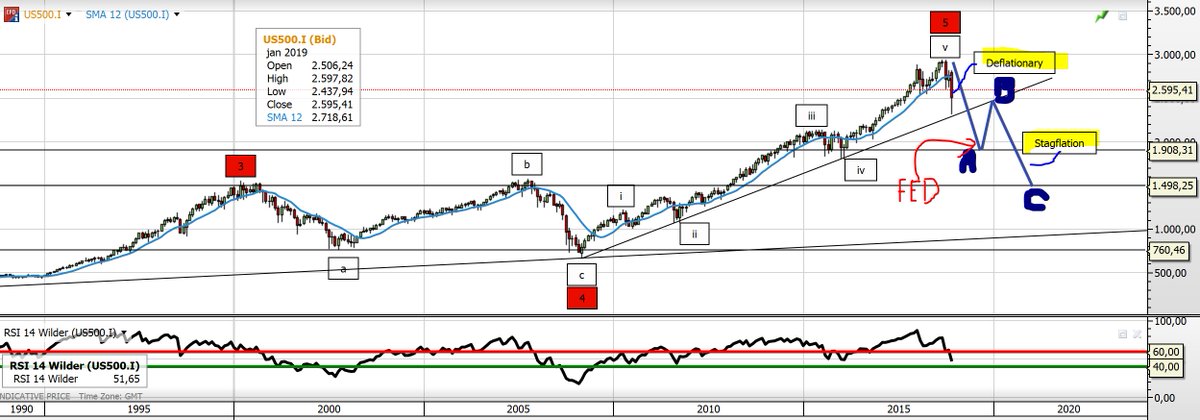
My LT-chart for #SP500 remains this. We are in the #deflationary part of this Bear market. At some point – when decline has progressed for some time, Fed will reenter the stage. Will create bounce lasting for months before next wave down due to Stagflation. #HZupdates
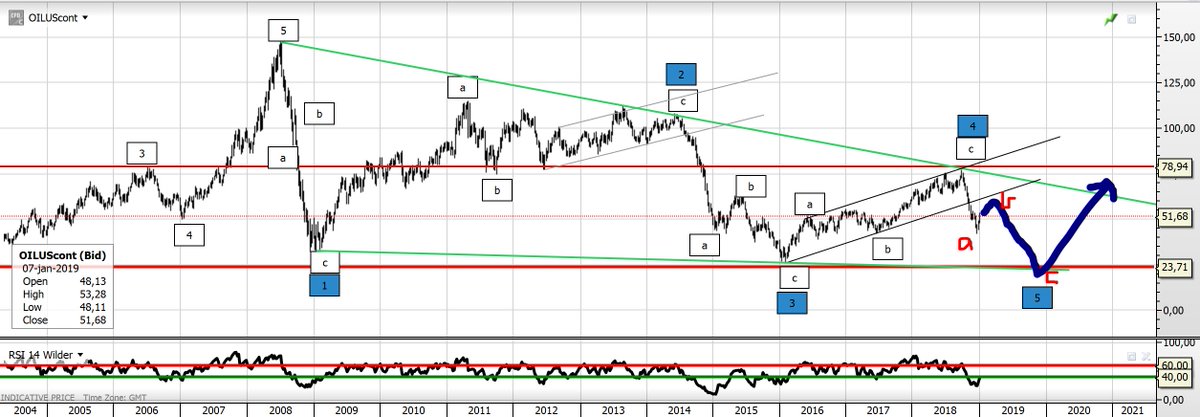
#Oil supports this outlook. Ending diagonal – Oil will reach target <23. This is deflationary and will be part of the recession, which I think we will see soon across the globe. #HZupdates
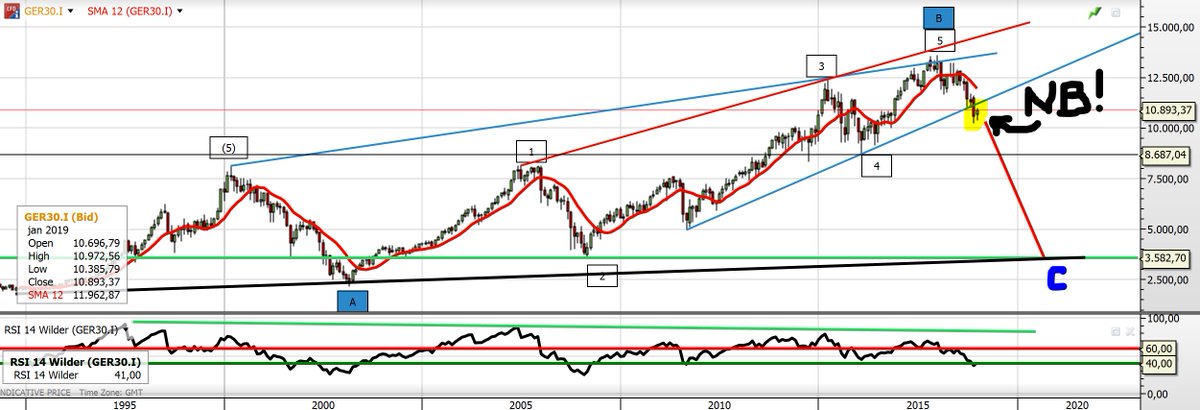
#Recession is probably already reality in EU and Germany. Again ECB shows complete lack of understanding of economic reality as they exit stimulus as recession is knocking on the door Remember ECB hike in 2008?
 #DAX looks terrible. Break of trendline LT-targt of ~3500 #HZupdates
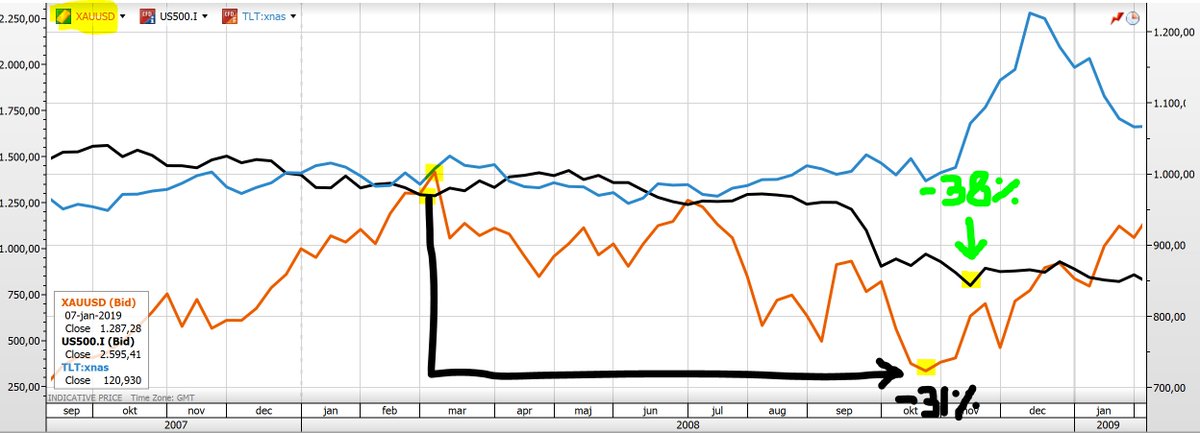
So – obviously #Gold must perform well, right? It always does in times of crisis, right? Answer: No! You have to distinguish between the economic regimes inside the crisis. In times of shortage of liquidity (read: USD), Gold performs really bad! Below is 2008 #HZupdates

#Gold dropped ~31% during 2008 and #SP500 dropped ~38% in same period. This is the DEFLATIONARY part of the decline – until the moment Fed reenters! The BLUE LINE? That is TLT! Why should things be different this time? #HZupdates
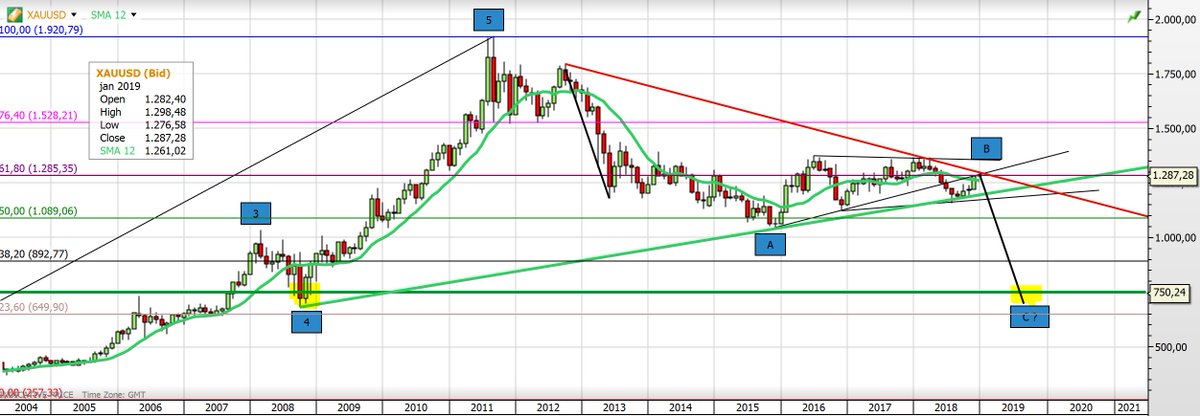
#Gold will drop in last wave C to my target 750-825 area in the Deflationary part of the crisis. We are at an important point. We can rally a little higher – but it will not change my forecast. Gold will drop! #HZupdates
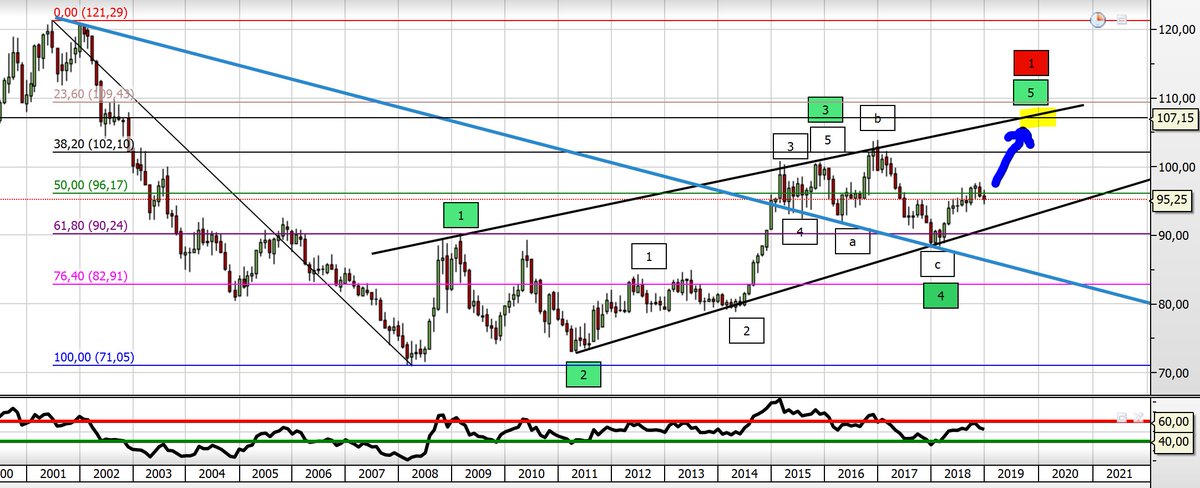
#DXY will be the main driver of the deflationary phase. QT and hikes are creating shortage of USD around the globe. We will see #DXY rally to min. 107 before a pot. top is in. #HZupdates
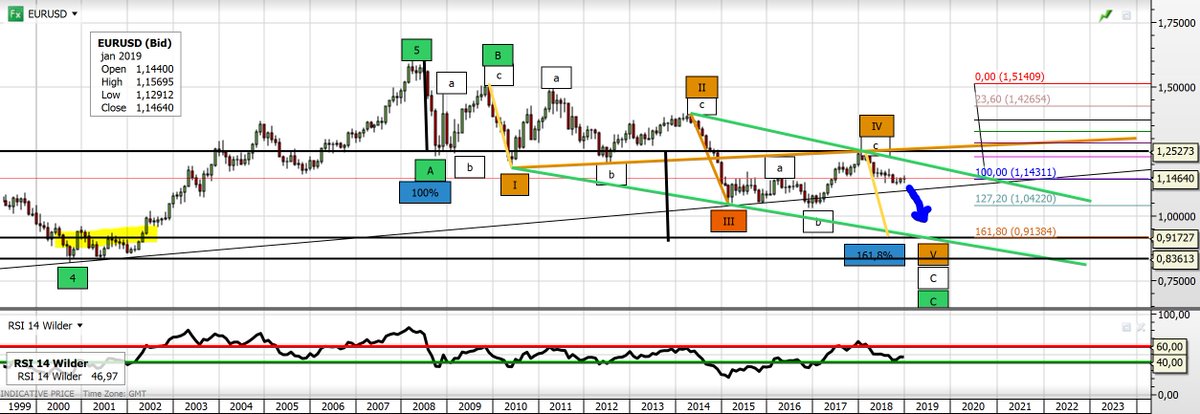
The rally in #DXY will be supported by a decline in EURUSD. My LT-target remains min. 0.91 – pot. lower. #HZupdates
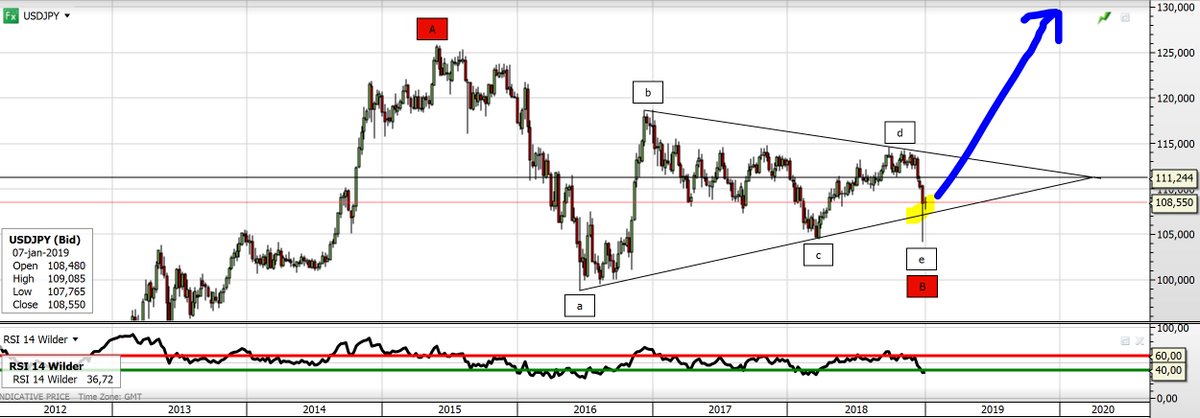
Another pair which suggests much higher levels for #USD #DXY is #USDJPY. Actually, it shows us, that we are at a very important junction. The sharp spike and rally up is a typical “e” wave in a triangle. This would finalize B(red) and will send USD soaring higher in C #HZupdates