by C Hamilton
2019 saw US population growth at its lowest percentage level in US history aside from the pandemic years of 1918/1919 (when the Spanish flu took the lives of nearly 700,000 Americans). The 0.5% annual growth meant US population grew by approx. 1.55 million persons in 2019.
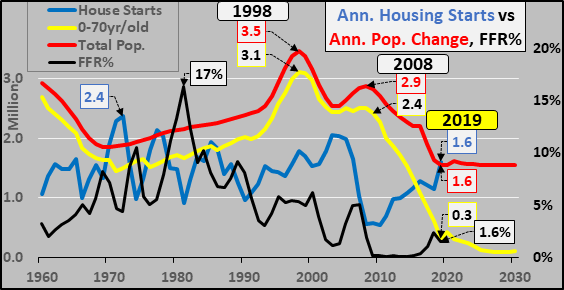
Today, I just wanted to focus on the implications of low population growth on the largest sector of the US economy, housing and in particular new housing starts. The chart below shows annual total US population growth in millions (red line, million), the next line is the US population growth among the under 70 year old population (yellow line, million), then annual housing starts (blue line, million), and finally the Federal Reserve set federal funds rate driving interest rates (black line, %).
Really take a minute to understand these relationships…its really important.
From 1960 to 2008, annual population growth (red line) varied from about 1.8 to 3.5 million a year and the vast majority of that growth came among the under 70 year old population (yellow line). During this nearly five decades, housing starts (blue line) varied from about 1 to 2 million units annually, with sharp inverse swings based on the cost of money represented by the changes in the federal funds rate (black line).
But starting in 2008, housing starts fell below 1 million units and would remain there through 2012 despite the cost of money (federal funds rate) sitting at zero for nearly a decade. The NAR and others suggest there is a housing shortage due to this period of significantly below trend housing starts…but if you happen to look at the red line (decelerating total population growth) and the yellow line (collapsing population growth among the under 70 year old population), perhaps something else is happening.
70+ year-old elderly folks have the highest home ownership rates, are least likely to undertake new loans, and have the lowest labor force participation rates among the adult population at something like 1 in 10 working versus 8 in 10 among 50 year-olds. In 2019, the 70+ population grew by about 1.3 million. Point is, 70+ year-olds are not net-buyers but net-sellers as they pay down/pay off their mortgages, downsize, move to managed care, or pass away.
It is the annual growth of the under 70 year-old population that drives demand for new housing, that has high levels of employment, and the willingness to undertake long term mortgage debt. In 2019, the under 70 year-old population grew by less than 300 thousand. The 90%+ annual deceleration in the potential buyers versus a ten-fold rise in the annual growth of elderly has turned the housing market upside down.
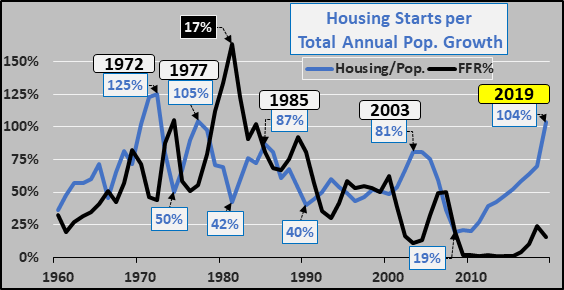
But last year, more new homes were started than the total population increased…something that had not happened since the early 1970’s. The chart below shows annual starts as a percentage of annual population growth moving inverse the federal funds rate. The sharp increase in housing starts amid a population growth slowdown is definitely noteworthy.
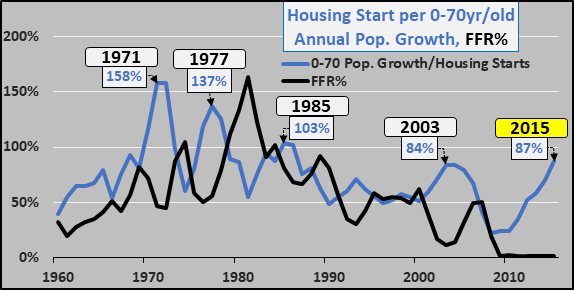
While the total annual population growth is decelerating, all the deceleration is among the under 70 year-old population (declining births, declining immigration) while the 70+ year-old population growth is still accelerating. The chart below details the annual housing starts as a ratio of annual under 70 year-old population growth from 1960 through 2015. Nearly 40 years of interest rate cuts have mitigated the deceleration in housing starts as a percentage of under 70 year-old population growth, until…
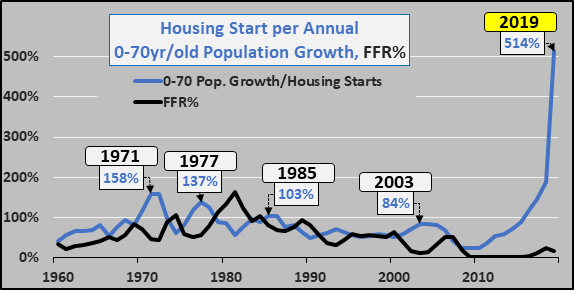
That is until now…2018 and particularly 2019 saw new housing starts surge while population growth of the under 70 year old population took another leg down. The result was more than five new housing starts per every new under 70 year-old in the US…aka, the hockey stick chart below.
Now, go back and look at the first chart again. You will notice that for the whole of the 2020’s, what projected population growth there is, is among the 70+ year-old population and, so long as the declining birth rates / total births and decelerating immigration continue, we should expect little to no growth among home buyers. The idea that America needs more housing seems strange indeed. Far more optimistic is that the 2020’s will see a period of replacement level new housing rather than outright growth…more realistic might be surging existing housing inventory as elderly sellers swamp the market on their way out and little to no new construction.
Of course, real estate is local. On a micro level, there is likely to be a surge of rural inventory, and inversely, increasingly tight urban inventory in select cities. This is due to a likely ongoing outflow of young adults from rural locales to select urban centers, in search of opportunity. Either way, the net picture is unchanged or even worsened as urban fertility and birth rates are even lower than those seen in rural areas. Or, then again, maybe the Federal Reserve can just print new buyers…or add residential real estate to its already bloated balance sheet so America can keep on building…ever more…for ever fewer?