via WSB:
I’m not going to give you a wall of text that you will probably skim through, instead I’d like to show you 4 graphs that I’ve studied at length which I feel depict my thesis in shortest amount of time then provide brief explanations
Thesis- The stock market is at an unsustainable high valuation and when tracking historical times of similar booms we see a sharp pullback in the years following a squeeze of like magnitude. High speculation coupled with total uncertainty in rate tapering timing will lead to a 30+% correction in the summer of 2021. Retail spending will be at ATH, supply shortages will be at ATH, and inflation levels will spike to 2009-2010 levels.
Graph #1 – Bank Of America Global Research Sell Side Indicator*(this charts buy and sell signals based on 15year averages)*
Graph #2 – VIX/VXV*( the VIX is a real-time market index representing the market’s expectations for volatility over the coming 30 days, the lesser know VXV measures implied volatility three months out. One way to look at fear/greed is to use the VIX divided by the VXV: VIX/VXV ratio )*
Graph #3 – Fibonacci Retracement (Fibonacci retracement levels are horizontal lines that indicate the possible locations of support and resistance levels. It shows how much of a prior move the price has retraced. The direction of the previous trend is likely to continue. However, the price of the asset usually retraces to one of the ratios listed above before that happens. )
Graph #4- VIX Bollinger Bands ( Bollinger Bands are curves drawn in and around the price structure usually consisting of a moving average (the middle band), an upper band, and a lower band that answer the question as to whether prices are high or low on a relative basis. The narrow bands suggest a period of low volatility. Widening bands suggest an increase in volatility often associated with a trending market environment )
CONCLUSION: History shows us there is cycles to our financial nature as human beings, analysis shows us the cycle end is nearing. Overvaluation, abundance of cash, and supply restrictions will ultimately lead to a correction in anticipation of coming inflation.
PREDICTIONS Federal reserve begins slowing asset purchasing in June and overvalued mid and small cap stocks will sell off to offset heavy weighted holdings( lowers taxes with realized losses), by July 4th news reports on lay offs from material shortages will begin, July and August will be red, and September-December will be a recovery back to 200 day moving averages.
I posted a follow up to provide further insight on what led me to this conclusion – see here:
After reading through many of your comments to my previous TA post regarding my market correction predictions, I wanted to follow up and highlight some key indicators that I excluded originally which help lay the picture for what I suspect is coming this summer.
- A Shiller P/E greater than 30 leads to a bear market, currently at 37. Black Friday had S-P/E of 30, dot com had 45 Source – 5/1/2021
- The forward 12-month P/E ratio for $SPX of 22.0 is well above the 5-year average (17.9) and the 10-year average (16.0). Well above 1999 levels Source – 5/1/2021
- The trailing 12-month P/E ratio for $SPX of 35.4 is well above the 5-year average (21.9) and well above the 10-year average (18.9) Well above 1999 levels Source – 5/1/2021
- $SPX is reporting Y/Y earnings growth of 45.8% for Q1, which is the highest earnings growth rate for the index since Q1 2010 (55.4%).Source – 5/1/2021
- Citi strategists believe the S&P500 is operating within a trading range of 3600-4000 Source-4/7/2021
- BOFA has issued a warning of 3800 Source – 4/21/2021
- S&P rises and falls of 3% or more in single days. This only took place in 1999 before the dot-com bubble burst Source – 5/1/2021
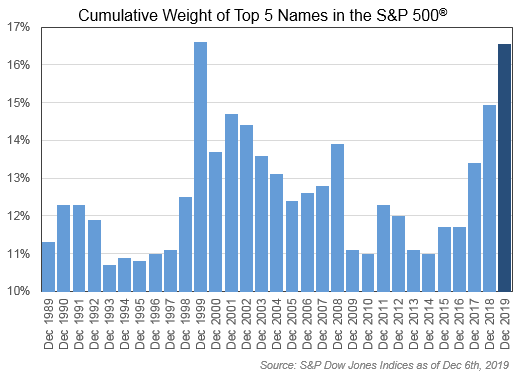
- TOP 5 weighted names(companies) of S&P is at 16.5% – same levels prior to dotcom bubble Source – 12/20/2020
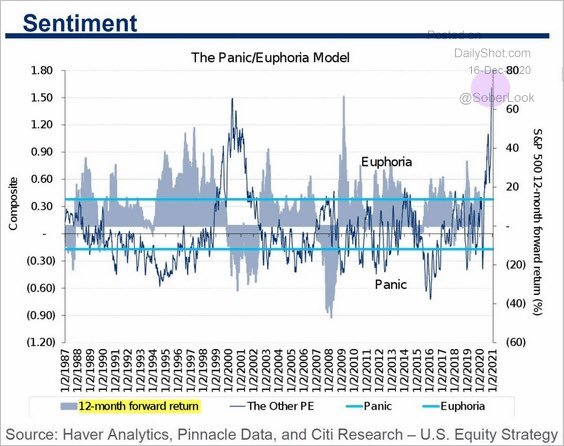
- PANIC/EUROPHIA MODEL CHART is at ATH readings. far surpassing that of dotcom bubble Source – 5/1/2021
- $SPX Q1 2021 earnings only can compare to 1998 levels in terms of historical relation. Source – 5/1/2021
I would continue listing but for timing purposes I’ll stop there
Dotcom bubble Vs. Current bubble
The NYSE advance has peaked and is now declining, even though the S&P and Dow continue higher or have went flat. This indicates that while the selective market indexes are moving higher, the broader market is struggling. Characteristically, our current financial markets fit the same picture as 1998-2002.
In 1998 the Federal Reserve cut interest rates in order to reduce the chances of an economic slowdown due to material and labor shortages. After this, money flooded the market resulting in the overvaluation of many equities and dotcom runup we saw prior to the bubble. – (We can relate this to coronavirus stimulus and subsequent interest rate reduction)
In the fall of 1999, with the market at ATH, the U.S. shrugged off the emerging-market crisis and the collapse of a large hedge fund(sound familiar?), the Fed reversed course and raised rates three times in 1999. – (We can relate this to the current market state, with many investors believing the market cannot go down, Bill Hwangs hedge fund seemingly brushed off, and federal reserve stating interest rates will be increased in the future.)
Following this, in 2000 financial institutions informed their clients the tech stock were no longer undervalued and the dotcom bubble selloff began. – (This is where I think we are heading this summer into 2022.)
Final Thoughts
To be clear, the outcome of the near term market relies heavily on how retail investors perceive current market conditions. Its my belief that once the general public has enough pressure on the federal administration to fully reopen the economy then tapering will be announced, lenders will raise rates and hedging will begin… triggering the sell off.
$SPY 350 & $VIX 50 by 7/15
Thank you to those who messaged me with kind words and questions. Knowing that my posts might help save someone from losing a portion of their hard earned assets makes all naysayers irrelevant. I am not a financial analyst, so I won’t provide guidance on your investments but just take a look at the OI for 9.17.2021 $350 puts then go do your own research.
Disclaimer: This information is only for educational purposes. Do not make any investment decisions based on the information in this article. Do you own due diligence or consult your financial professional before making any investment decision.