As I warned earlier this week, stocks have lost their 200-day moving average (DMA).
This is a MAJOR development. In terms of seasonality, things are usually quite bullish this time of year (the famed “Santa rally”). The fact the bulls failed to keep the S&P 500 above its 200-DMA despite this is VERY bearish.
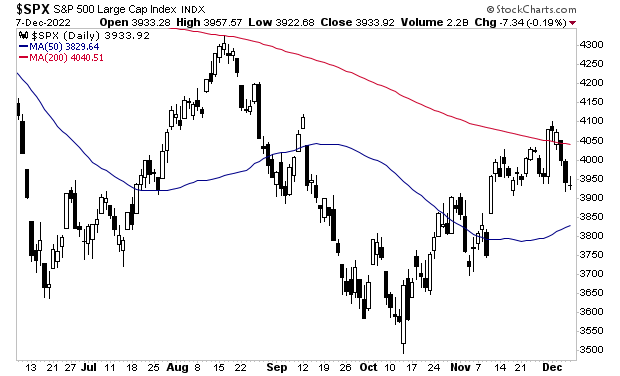
Remember, the 200-DMA is like a “line in the sand” for long term trends in the market. During bull markets, stocks rarely break below it. And during bear markets, stocks rarely break above it. You can see this relationship clearly in the below chart. The 200-DMA is the red line.
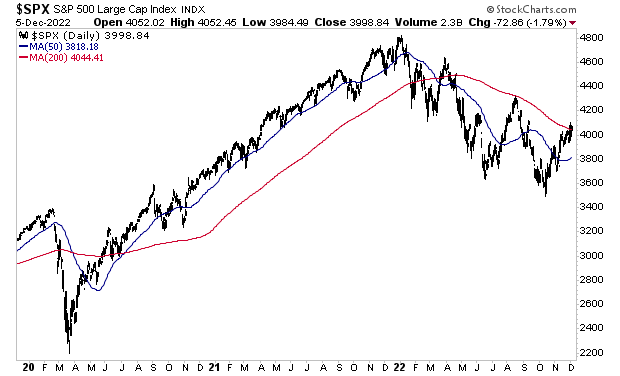
Put simply, the failure to maintain the 200-DMA indicates that this recent market rally was nothing more than a Bear Market Rally, NOT the start of a new Bull Market.
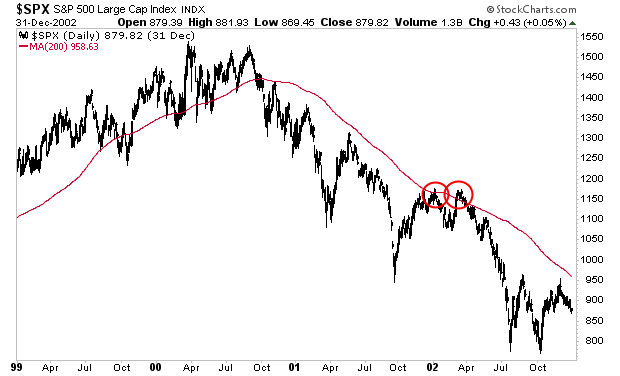
Below is a chart of what happened to stocks when they failed to maintain their 200-DMA during the Bear Market of 2000-2003. I’ve highlighted this in red circles. Stocks dropped another 30%.
Here’s the same development during the bear market of 2007-2009. This time around stocks lost 50%.
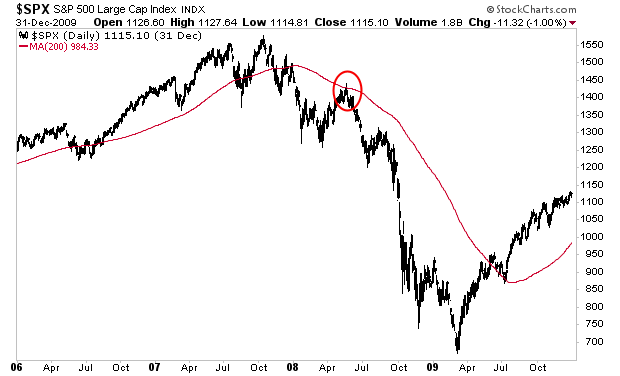
So again, the bear market is not over. The trend remains down. And stocks could lose another 30%-50% in the next 12 months.