
by UPFINA
In the next few months, the housing market is going to cool off because more supply will come on the market, rates are rising, and the trend of people moving to the suburbs is going to partially reverse. Single family housing benefited from the virus. Once the pandemic is over, we will see some weakness. Some upper income class people bought a 2nd or 3rd home to get away from the city. That won’t be necessary after the pandemic. On the other hand, millennials will still favor moving to the suburbs because they are getting older and starting families.
As you can see from the chart below, the number of homes for sale plummeted during the pandemic because some didn’t want to have open houses which would risk spreading the virus. Now that housing is getting more expensive and the risk of the virus is being mitigated, the number of homes for sale will normalize. It might actually spike more than recent years because people who delayed selling their house will put it on the market.
"Who wants to sell a house in the middle of a pandemic? That’s what I keep coming back to. Is this a time you want to open your house up to people walking through it? No, of course not." https://t.co/8Utr7jFivQ pic.twitter.com/lMhcWHhMV1
— Jesse Felder (@jessefelder) February 26, 2021
The MBA purchase application data was hurt by the extreme weather in Texas. Yearly growth fell from 15% to 7% in the week of February 19th. Weekly growth fell from -6% to -12%. Once the yearly comps start getting harder in a couple months, we might see negative yearly growth. Refinancing fell 11% week over week. Rising rates are going to hurt refinancing severely since most people who could refinance probably did so in 2020. The pending home sales index in January fell from 126.4 to 122.8 which is a 2.8% decline. That missed estimates for no change. The pending home sales index is a leading index for housing. It signals moderation is coming this spring selling season.
New home sales in January were up from 885,000 to 923,000 which beat estimates for 885,000 and the highest estimate which was 905,000. It’s going to be interesting to watch this figure as the economy reopens. Remember, home builders are being hit by rising costs. Homebuilders in Alabama said lumber alone makes building a home $24,000 more expensive (lumber prices are at a record high).
Great Jobless Claims Report
The jobless claims report last week was poor. This one was much better. Last week’s reading was revised down by 20,000 to 841,000 which is still quite high. As you can see from the chart below, initial claims fell to 730,000 which was below the consensus of 815,000 and near the low end of the estimate range.
As you can see from the chart below, the trend of increasing initial claims is over. The stubbornly high claims from November to January occurred because of the 3rd wave of the pandemic. Results might be better in the coming weeks as the pandemic ends. Obviously, the bad weather in Texas impacts all economic data points from mid-February.
Over the past six months, initial jobless claims have held to a range between 711k and 927k with mean of 816k and a median and mode of 812k. Today's drop to 730k did not break the range but it seems to mark an inflection point. pic.twitter.com/H4OrPbCMOP
— Jeoff Hall (@JeoffHall) February 25, 2021
Non-seasonally adjusted claims also fell sharply. They were down 132,000 to 710,000. PUA claims were down 61,000 to 451,000. As you can see from the chart below, total non-seasonally adjusted claims fell 14% following the 12% spike last week. We’re inching towards a new cycle low. The large non-seasonally adjusted decline was caused by Ohio and California which fell 46,000 and 50,000. The decline in Ohio will probably continue because likely fraud brought them implausibly high in prior weeks.
🇺🇸 Encouraging but volatile! Initial #unemployment benefit claims⬇️ in w-e Feb 20.
Regular claims:
🟢730k (SA): -111k
🟢710k (NSA): -132kPUA (NSA):
🟢451k: -61k🛑OH & CA very bouncy data
🚨 Still very high 1.2 million *new* weekly jobless benefits claimants pic.twitter.com/6Zo4PAQKBE
— Gregory Daco (@GregDaco) February 25, 2021
In the week of February 6th, the total number people on all benefits programs rose from 18.34 million to 19.04 million. In the week of February 13th, the number of continued claims fell from 4.52 million to 4.419 million. The extra $300 in unemployment benefits will expire on March 14th if a stimulus isn’t passed. It’s unsurprising that even with the government ruled by one party they still can’t get anything done early. You should almost always expect Congress to use all the time it has (and break deadlines). We aren’t worried about if it will pass. It will happen. Current proposed legislation will give the unemployed an extra $400 per week.
January Durable Goods Orders
The January durable goods orders reading was very strong even with the pandemic at its peak that month. Monthly new orders growth rose from 1.2% to 3.4% which more than tripled the consensus of 1.1% even though there was a 1% positive revision. Excluding transportation, orders were up 1.4% which more than doubled estimates (of 0.6%) but fell 3 tenths from last month.
Core capital goods orders were up 0.5% monthly after rising 1.5%. Yearly non-defense core capital goods orders were up 9.1% which was down from 9.6% growth last month. These readings didn’t have very easy comps. The economy was weak before the pandemic, but showing signs of getting better. Yearly growth will be even stronger when the easy comps are met in the next couple months.
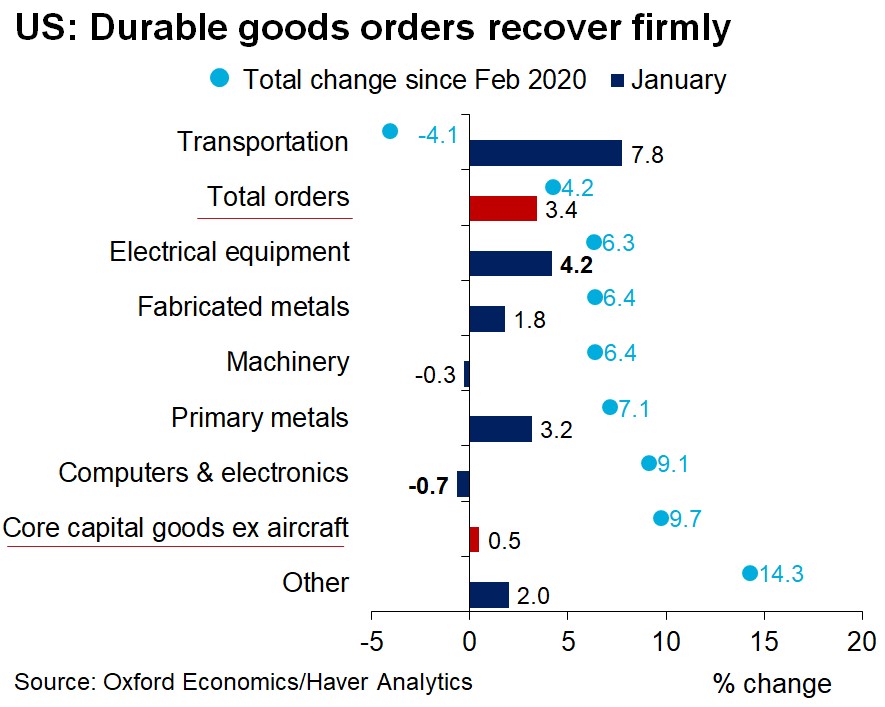
As you can see from the chart above, transportation orders drove results which is less sustainable than a cyclical improvement in core orders. That being said, core orders have been strong in the past few months. They are up 9.7% from before the pandemic started. Computers and electronics orders were down 0.7%.
There is a shortage in semiconductors. This shortage was caused by the increase in demand for PCs (11% growth in 2020 was the highest in a decade) and data center usage during the pandemic. Plus, there was a spike in cryptocurrency mining. You can see the shortage in the SOXX semiconductor ETF which is up 37.9% in the past 6 months. The 136% rally since last March is its biggest burst of strength since it was created in 2001. The shortage is hurting the production of vehicles and video game consoles.
Conclusion
The housing market is going to cool off in the next few months. Don’t get confused by this. It’s not the end of a bubble. Cooling off is actually healthy for the market because it was getting unaffordable. Jobless claims are starting to improve again. Look for much better data in March. The January durable goods orders report was very good. There is a shortage of semiconductors.