by UPFINA
We know that stocks are rallying because of hopes for a cyclical recovery in 2020. However, it is still amazing to watch stocks continue to rally, even as they are overbought, while some Q4 GDP growth estimates fall below 1%. The S&P 500 is up 24.48% year to date as of Friday in part due to trade deal hopes and an expected cyclical recovery. The S&P 500 has experienced 28 trading days without back to back losses. That’s the longest streak in almost eight years. The VIX has been below 15 for 25 days. The 2019 high streak is 26 days. There was a 66 day streak prior to the 20% correction in Q4 2018.
On the other hand, Oxford Economics sees 1.3% Q4 GDP growth. It lowered its estimate for consumer spending growth from 2.9% to 1.4% because of the October retail sales report we will discuss in this post. Even though the October retail sales report was weak, there’s reason to think the consumer is primed to have a solid holiday shopping season as its savings rate is above last year’s rate, it isn’t leveraged, and there is near full employment with low inflation. Conversely, the Bloomberg Consumer Comfort index has crashed in the past 3 weeks. The October retail sales report caused JP Morgan to lower its Q4 GDP growth estimate from 1.75% to 1.25%.
Four GDP tracking estimates came down an average 0.43-pp between last Friday and today. pic.twitter.com/3bciREbWc6
— Jeoff Hall (@JeoffHall) November 15, 2019
The table above shows the usually very bullish St. Louis Fed only sees 1.5% growth. The NY Fed’s estimate was brought down by the industrial production report which we will also discuss in this post (these estimates could be too bearish because it was hurt by the GM strike). The retail sales report didn’t hurt it probably because it’s estimate for consumer spending growth was already low. It’s GDP estimate fell from 0.73% to 0.39%. Keep in mind, this is the prediction that perfectly forecasted Q3 growth. Finally, the Atlanta Fed Nowcast fell from 1% to 0.3% as the estimates for real personal consumption expenditures and real gross private domestic investment growth fell to 1.7% and -4.4%. Those are terrible, borderline recessionary numbers.
Okay Retail Sales Growth
The October retail sales report was okay as the Redbook weekly reports projected. The Redbook reports to start November aren’t great, but all that matters is the 2nd half of November which hasn’t happened yet (holiday shopping). The weak October motor vehicle sales report implied motor vehicles and parts sales growth would be weak in the retail sales report. Its monthly growth actually rebounded from -0.77% to 0.53%, but its yearly growth fell from 5.21% to 4.46%. This is the most important category in the report. This explains why headline monthly retail sales growth was 0.3% which beat estimates for 0.2%.
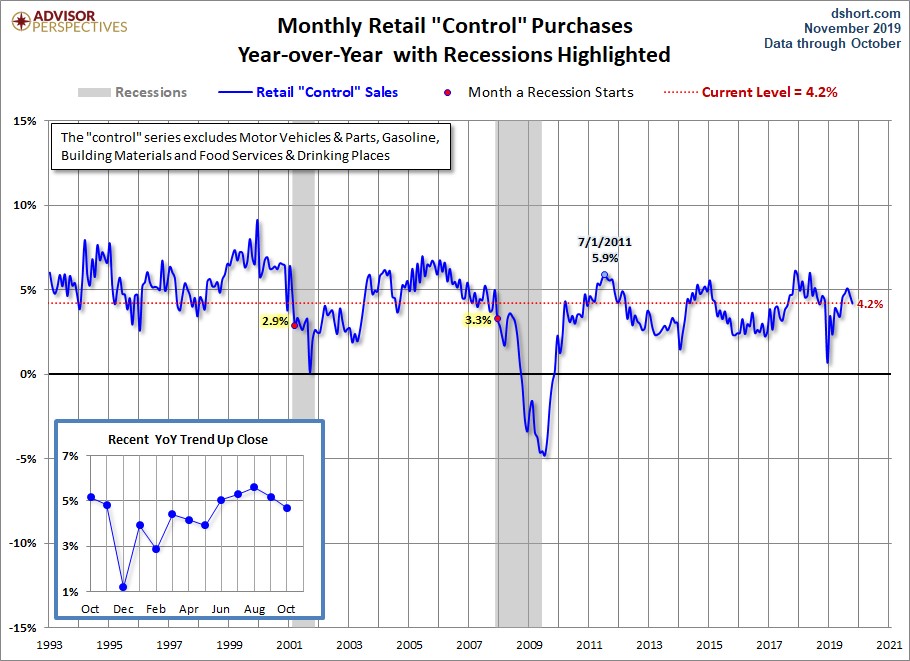
Everything else missed though as monthly growth without autos was 0.2% which was half of estimates. Monthly growth without gas and autos was 0.1% which was a third of estimates. Gas stations had 1.1% monthly growth and yearly growth that fell from -1.93% to -4.97%. The comp gas prices face in November is much easier, so yearly gas station sales growth should increase next month. The all-important non-store (online) category saw 0.92% monthly growth and yearly growth that improved from 13.93% to 14.25%. Monthly sales growth in the control group was 0.3% which missed estimates by one tenth. As you can see from the chart below, yearly nominal growth fell to 4.2%. On this basis, the report looks better than it does when you use other metrics.
Unlike the control group, the other yearly metrics are towards the low end of growth this cycle. All of the three metrics we will discuss next have seen growth fall two consecutive months to the lowest reading since May. Yearly growth excluding food services fell from 3.8% to 2.9%. Yearly growth with food services fell from 4.1% to 3.1%. Real retail sales growth fell from 2.3% to 1.3%. The good news is the two year growth stacks didn’t change much because in October 2018 growth for the three readings improved 1%, 0.9%, and 0.7%.
As we anticipate holiday retail sales, keep in mind that Black Friday is six days later than it was in 2018. Cyber Monday is actually December 2nd. This will push sales into December. The time between Black Friday and Christmas is six days less. The December 2018 retail sales report was terrible. Advanced yearly retail sales growth excluding food services was 1% which was the worst reading of the cycle. When you see strong yearly sales growth this December, look at the two year growth stack to compare results to prior months and holiday shopping seasons.
Not Great Industrial Production Growth
The GM strike pushed October industrial production growth lower, but even without it, this wasn’t a great report. Monthly production growth was -0.8% which doubled the decline expected. Manufacturing growth was -0.6% missing estimates for -0.5%. The capacity to utilization rate cratered from 77.5% to 76.7% which missed estimates by 0.5%. This was the biggest monthly decline since March 2009. Yearly industrial production fell 1.1% which was the biggest decline since September 2016. The chart below shows without motor vehicles and parts (meaning without the GM strike) growth was still weak as it was -0.55%. Yearly motor vehicle and parts production was down 11.8%.
Everyone will blame GM again for the IP numbers but excluding motor vehicles and parts still shows continued deceleration. pic.twitter.com/EjoP74BCiZ
— Eric Basmajian (@EPBResearch) November 15, 2019
The chart below shows this report’s weakness as more than 2/3rds of manufacturing subsectors were in a contraction.
US #manufacturing going through its worst slump since 2009. More than 2/3 of sub-sectors are in contraction… pic.twitter.com/JuPmQ9Z43f
— Gregory Daco (@GregDaco) November 15, 2019
Yearly manufacturing growth was -1.5% which was the weakest growth since May 2016. The trough last manufacturing recession was -2%. This slowdown is pretty bad when you consider that mining growth isn’t an issue. This weakness has nothing to do with energy prices. Mining production was up 2.7%; in May 2016 it was -10.5%. It troughed at -12.4%. Yearly business equipment production growth was -2.5% which is still far away from the previous cycle trough of -7%. Utilities growth was -4.1% partially because of the weather. November has been a cold month, so this might change in the next report. Finally, industrial production of consumer goods fell 2.2% which was one of the weakest readings of this expansion. The weakest was this April at -2.8%.
Conclusion
Stocks are rallying while estimates for Q4 GDP growth have fallen below 1%. On the bright side, the retail sales report wasn’t as disastrous as it seems because the 2 year growth stacks barely changed. November will be interesting because Cyber Monday isn’t in November like it was last year. December includes Cyber Monday and is facing very easy comps. Look at the 2 year growth stack to measure performance. This holiday shopping season could be strong, pushing GDP estimates above 2%. The industrial production report was weak even if you ignore the GM strike. Those betting on a cyclical upswing see this as one of the last few weak reports in this mini cycle.