BY SRSROCCO
While the U.S. Shale Industry produces a record amount of oil, it continues to be plagued by massive oil decline rates and debt. Moreover, even as the companies brag about lowering the break-even cost to produce shale oil, the industry still spends more than it makes. When we add up all the negative factors weighing down the shale oil industry, it should be no surprise that a catastrophic failure lies dead ahead.
Of course, most Americans have no idea that the U.S. Shale Oil Industry is nothing more than a Ponzi Scheme because of the mainstream media’s inability to report FACT from FICTION. However, they don’t deserve all of the blame as the shale energy industry has done an excellent job hiding the financial distress from the public and investors by the use of highly technical jargon and BS.
For example, Pioneer published this in the recent Q2 2018 Press Release:
Pioneer placed 38 Version 3.0 wells on production during the second quarter of 2018. The Company also placed 29 wells on production during the second quarter of 2018 that utilized higher intensity completions compared to Version 3.0 wells. These are referred to as Version 3.0+ completions. Results from the 65 Version 3.0+ wells completed in 2017 and the first half of 2018 are outperforming production from nearby offset wells with less intense completions. Based on the success of the higher intensity completions to date, the Company is adding approximately 60 Version 3.0+ completions in the second half of 2018.
Now, the information Pioneer published above wasn’t all that technical, but it was full of BS. Anytime the industry uses terms like “Version 3.0+ completions” to describe shale wells, this normally means the use of “more technology” equals “more money.” As the shale industry goes from 30 to 60 to 70 stage frack wells, this takes one hell of a lot more pipe, water, sand, fracking chemicals and of course, money.
However, the majority of investors and the public are clueless in regards to the staggering costs it takes to produce shale oil because they are enamored by the “wonders of technology.” For some odd reason, they tend to overlook the simple premise that…
MORE STUFF costs MORE MONEY.
Of course, the shale industry doesn’t mind using MORE MONEY, especially if some other poor slob pays the bill.
Shale Oil Industry: Deep The Denial
According to a recently released article by 40-year oil industry veteran, Mike Shellman, “Deep The Denial,” he provided some sobering statistics on the shale industry:
I recently put somebody very smart on the necessary research (SEC K’s, press releases regarding private equity to private producers, etc.) to determine what total upstream shale oil debt actually is. We found it to be between $285-$300B (billion), both public and private. Kallanish Energy Consultants recently wrote that there is $240B of long term E&P debt in the US maturing by 2023 and I think we should assume that at least 90 plus percent of that is associated with shale oil. That is maturing debt, not total debt.
… By year end 2019 I firmly believe the US LTO industry will then be paying over $20B annually in interest on long term debt.
Using its own self-touted “breakeven” oil price, the shale oil industry must then produce over 1.5 Million BOPD just to pay interest on that debt each year. Those are barrels of oil that cannot be used to deleverage debt, grow reserves, not even replace reserves that are declining at rates of 28% to 15% per year… that is just what it will take to service debt.
Using its own “breakeven” prices the US shale oil industry will ultimately have to produce 9G BO of oil, as much as it has already produced in 10 years…just to pay its total long term debt back.
Using Mike’s figures, I made the following chart below:
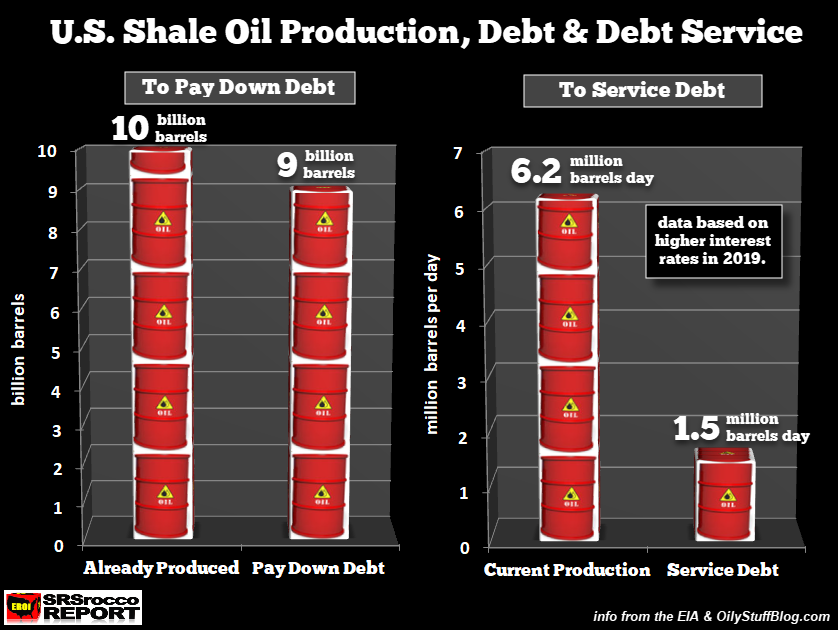
For the U.S. Shale Oil Industry just to pay back its debt, it must produce 9 billion barrels of oil. That is one heck of a lot of oil as the industry has produced about 10 billion barrels to date. Again, as Mike states, it would take 9 billion barrels of shale oil to pay back its $285-300 billion of debt (based on the shale industry’s very own breakeven prices).
Furthermore, the shale industry may have to sell a quarter of its oil production (1.5 million barrels per day) just to service its debt by the end of 2019. According to the EIA, the U.S. Energy Information Agency, total shale oil (tight oil) production is now 6.2 million barrels per day (mbd):
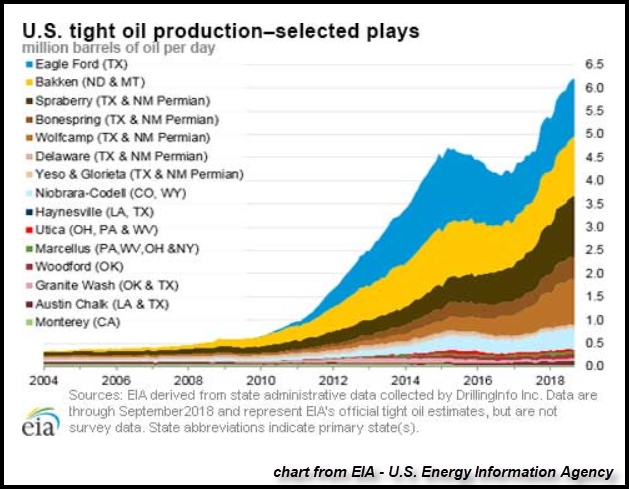
The majority of shale oil production comes from three fields and regions, the Eagle Ford (Blue), the Bakken (Yellow) and the Permian (light, medium & dark brown). These three fields and regions produce 5.2 mbd of the total 6.2 mbd of shale production.
Unfortunately, the shale industry continues to struggle with mounting debt and negative free cash flow. The EIA recently published this chart showing the cash from operations versus capital expenditures for 48 public domestic oil producers:
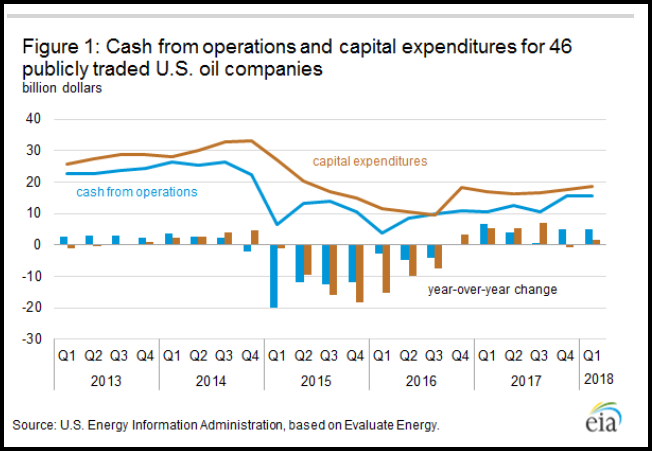
You will notice that capital expenditures (brown line) are still higher than cash from operations (blue line). So, it doesn’t seem to matter if the oil price is over $100 (2013-2014) or less than $70 (2017-2018), the shale oil industry continues to spend more money than it’s making. The shale energy companies have resorted to selling assets, issuing stock and increasing debt to supplement their inadequate cash flow to fund operations.
A perfect example of this in practice is Pioneer Resources… the number one shale oil producer in the mighty Permian. While most companies increased their debt to fund operations, Pioneer decided to take advantage of its high stock price by raising money via share dilution. Pioneer’s outstanding shares ballooned from 115 million shares in 2010 to 170 million by 2017. From 2011 to 2016, Pioneer issued a staggering $5.4 billion in new stock:
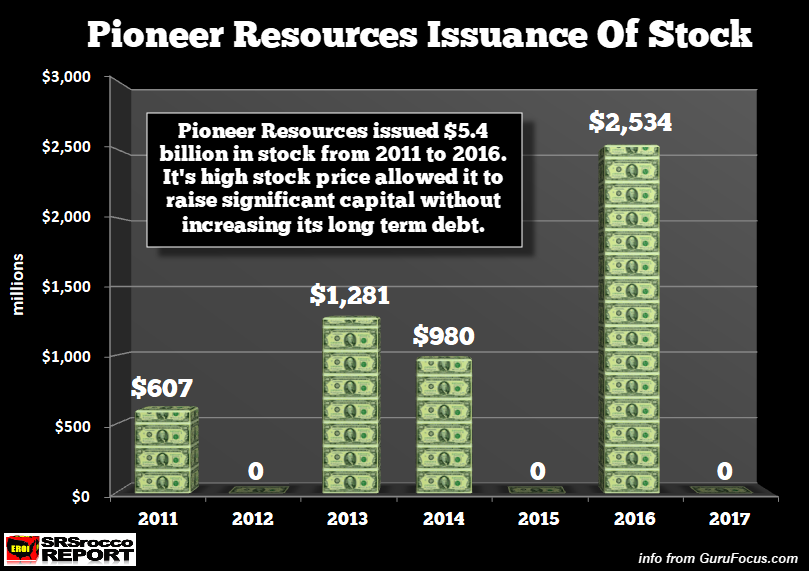
So, as Pioneer issued over $5 billion in stock to produce unprofitable shale oil and gas, Continental Resources racked up more than $5 billion in debt during the same period. These are both examples of “Ponzi Finance.” Thus, the shale energy industry has been quite creative in hoodwinking both the shareholder and capital investor.
Now, there is no coincidence that I have focused my research on Pioneer and Continental Resources. While Continental is the poster child of what’s horribly wrong with the shale oil industry in the Bakken, Pioneer is a role model for the same sort of insanity and delusional thinking taking place in the Permian.
Pioneer Spends A Lot More Money With Unsatisfactory Production Results
To be able to understand what is going on in the U.S. shale industry, you have to be clever enough to ignore the “Techno-jargon” in the press releases and read between the lines. As mentioned above, Pioneer stated that it was going to add a lot more of its “high-tech” Version 3.0+ completion wells in the second half of 2018 because they were outperforming the older versions.
Well, I hope this is true because Pioneer’s first half 2018 production results in the Permian were quite disappointing compared to the previous period. If we compare the increase of Pioneer’s shale oil production in the Permian versus its capital expenditures, something must be seriously wrong.
First, let’s look at a breakdown of Pioneer’s Permian energy production from their September 2018 Investor Presentation:
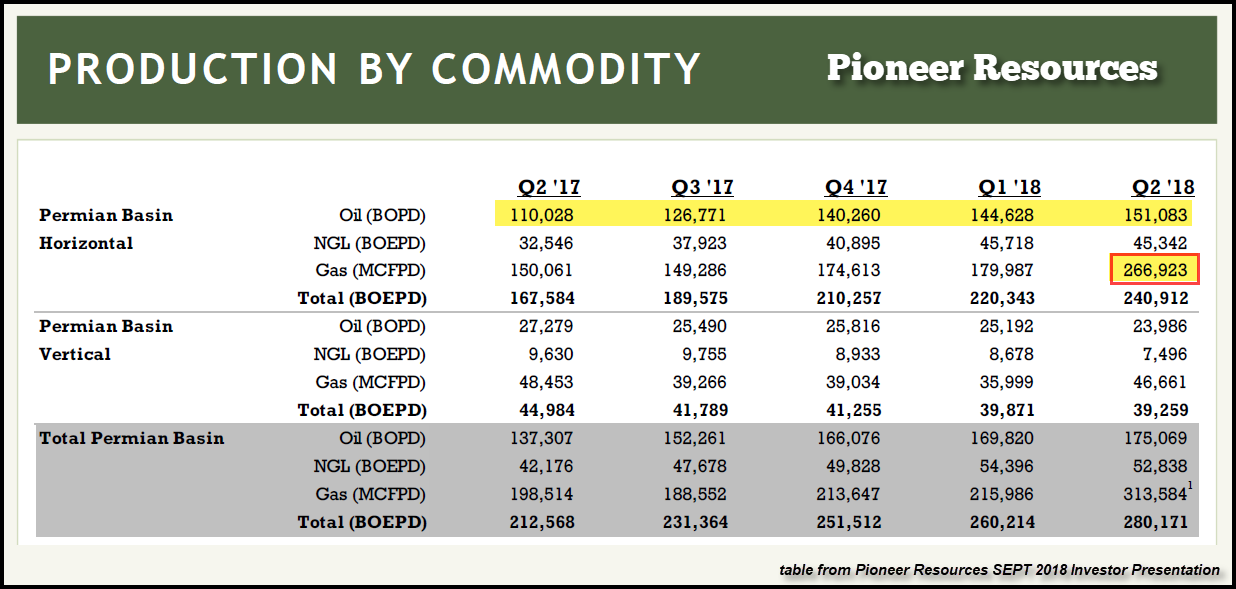
Pioneer’s Permian oil and gas production is broken down between its horizontal shale and vertical convention production. I will only focus on its horizontal shale production as this is where the majority of their capital expenditures are taking place. The highlighted yellow line shows Pioneer’s horizontal shale oil production in the Permian Basin.
You will notice that Pioneer’s shale oil production increased significantly in Q3 & Q4 2017 versus Q1 & Q2 2018. Furthermore, Pioneer’s shale gas production surged in Q2 2018 by nearly 50% (highlighted with a red box) compared to oil production only increasing 5%. That is a serious RED FLAG for natural gas production to jump that much in one quarter.
Secondly, by comparing the increase of Pioneer’s quarterly shale oil production in the Permian with its capital expenditures, the results are less than satisfactory:
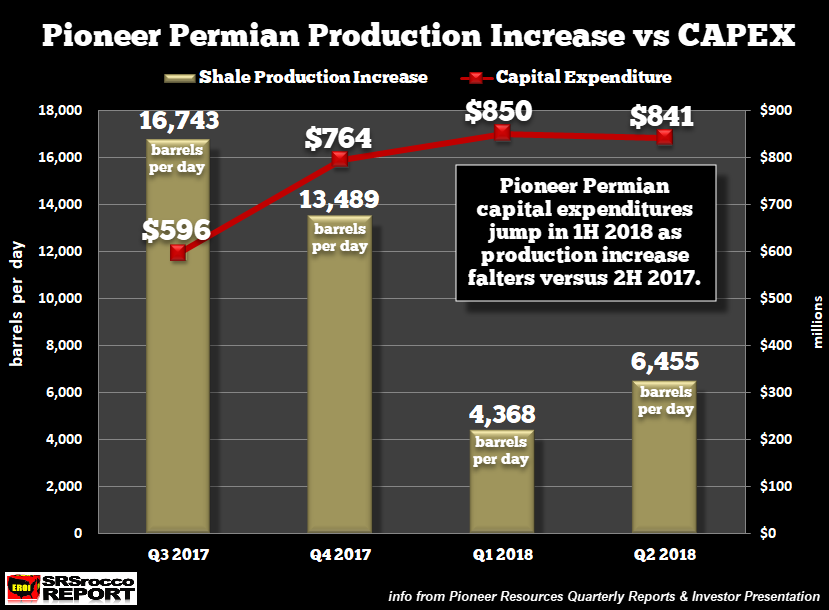
The RED LINE shows the amount of capital expenditures spent each quarter while the OLIVE colored BARS represent the increase in Permian shale oil production. To simplify the figures in this chart, I made the following graphic below:

Pioneer spent $1.36 billion in the second half of 2017 to increase its Permian shale oil production by 30,232 barrels per day (bopd) compared to $1.7 billion in the first half of 2018 which only resulted in an additional 10,832 bopd. Folks, it seems as if something seriously went wrong for Pioneer in the Permian as the expenditure of $340 million more CAPEX resulted in two-thirds less the production growth versus the previous period.
Third, while Pioneer (stock ticker PXD) proudly lists that they are one of the lowest cost shale producers in the industry, they still suffer from negative free cash flow:

As we can see, Pioneer lists their breakeven oil price at approximately $22, which is downright hilarious when they spent $132 million more on capital expenditures than the made in cash from operations:
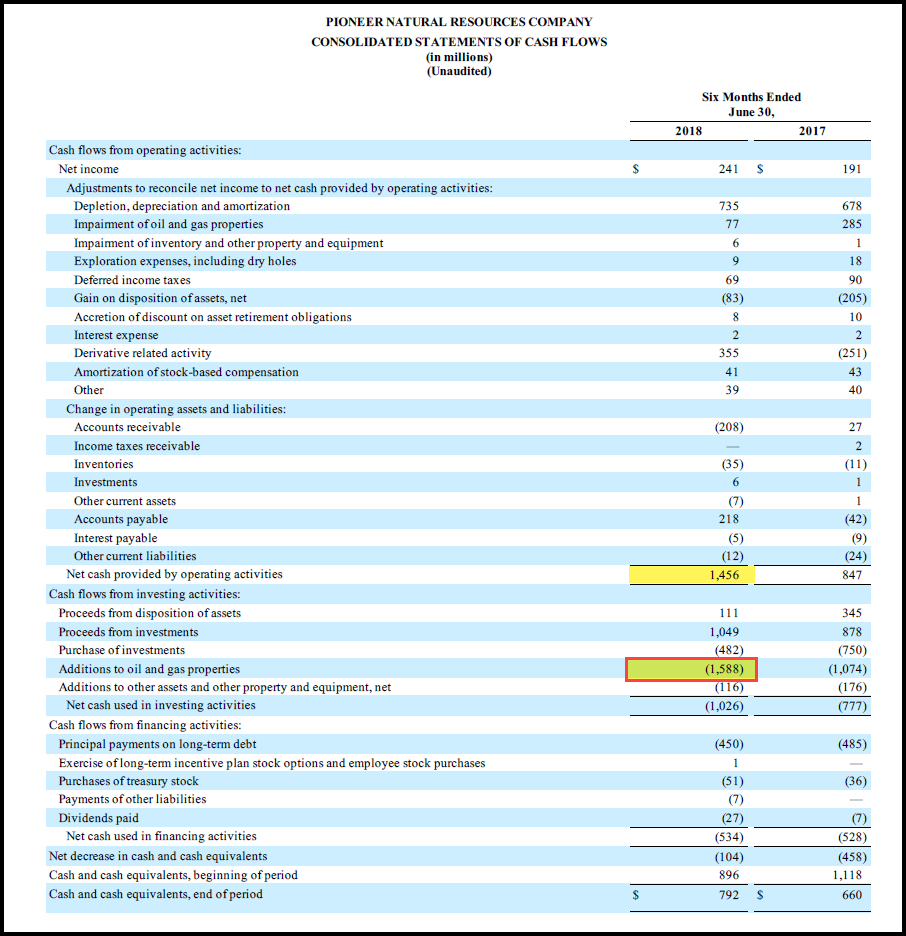
The public and investors need to understand that “oil breakeven costs” do not include capital expenditures. And according to Pioneer’s Q2 2018 Press Release, the company plans on spending $3.4 billion on capital expenditures in 2018. The majority of the capital expenditures are spent on drilling and completing horizontal shale wells.
For example, Pioneer brought on 130 new wells in the first half of 2018 and spent $1.7 billion on CAPEX (capital expenditures) versus 125 wells and $1.36 billion in 2H 2017. I have seen estimates that it cost approximately $9 million for Pioneer to drill a horizontal shale well in the Permian. Thus, the 130 wells cost nearly $1.2 billion.
However, the interesting thing to take note is that Pioneer brought on 125 wells in 2H 2017 to add 30,000+ barrels of new oil production compared to 130 wells in 1H 2018 that only added 10,000+ barrels. So, how can Pioneer add five more wells (130 vs. 125) in 1H 2018 to see its oil production increase a third of what it was in the previous period?
Regardless, the U.S. shale oil industry continues to spend more money than they make from operations. While energy companies may have enjoyed lower costs when the industry was gutted by super-low oil prices in 2015 and 2016, it seems as if inflation has made its way back into the shale patch. Rising energy prices translate to higher costs for the shale energy industry. Rinse and repeat.
Unfortunately, when the stock markets finally crack, so will energy and commodity prices. Falling oil prices will cause severe damage to the Shale Industry as it struggles to stay afloat by selling assets, issuing stock and increasing debt to continue producing unprofitable oil.
I believe the U.S. Shale Oil Industry will suffer catastrophic failure from the impact of deflationary oil prices along with peaking production. While U.S. Shale Oil production has increased exponentially over the past decade, it will likely come down even faster.