(Bloomberg) — How good does this bull market feel? One way of answering that might be to consider returns adjusted for time. Right now, if you had the supernatural good fortune to have bought stocks at the bottom of the financial crisis, your annualized return in the S&P 500 is right around 18%.
Here’s a chart of how that number — roughly speaking, a gain of 526% divided among 11 years — has evolved since 2013. It’s the annualized return since the bull market began, plotted each day. Note that even though shares have risen a lot over the chart’s interval, the drift is gently down. Which makes sense: Given the steepness of the advance when the rally was young, it takes ever-sharper gains to hold the number aloft as time ticks by.

Now here’s a comparable snapshot of the internet bubble, its last five years ending in 2000, presented in the same fashion. It’s annualized returns in the S&P 500 since Oct. 11, 1990, plotted each day. A testament to the snowballing effect of returns during that episode, rather than going downward, the time-adjusted return in the S&P 500 in many cases got bigger as time went by.

For those fretting that the market has come completely off its tether, the comparison may offer a measure of comfort. True, the S&P 500’s rally over the past year has defied everything from a U.S.-China trade war to stagnant corporate earnings to the outbreak of the coronavirus. But the price actions shows a market whose return profile is in some respects steady.
If nothing else, the slope of the line is a reminder that it wasn’t too long ago that stocks were stagnant. The S&P 500 went virtually nowhere for almost two years starting in January 2018, a fallow period that goes a long way toward keeping returns in check.
While this bull market is the longest in duration, entering its 12th year next month, its momentum hasn’t been that robust. At 18.3% a year, the time-adjusted rate of expansion trails all but one of the 12 previous bull markets. The length of the rally is what’s truly remarkable. Nevertheless, at 526%, still a bit short of the 545% recorded during the dot-com era.
Yet the VIX index remains low by historic standards despite the Coronavirus and other global risks.
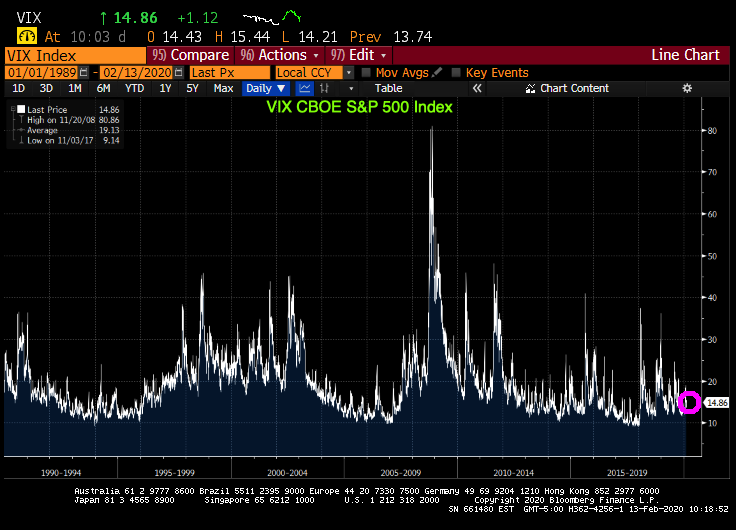
The VIX is even low given the season compared to previous readings.

Of course, The Federal Reserve is always on stand-by to support markets. The yellow line is The Fed Balance Sheet.

Is The Fed preventing markets from functioning properly by allowing overinflated asset values to continue unlike previous bubble moments?