via ANG Traders
- Fractals are similar patterns that repeat at different time scales.
- The tech rally of 1999-2000 and the present bull market have common fractal patterns.
- The present correction continues to fit with the pattern of 2000.
Fractals are patterned shapes that exist at different temporal scales. They are ubiquitous in nature, such as the large-scale outline of a continental coastline, and the close-up outline of a smaller chunk of the coastline; both show the same shape but at different scales. It is not clear why fractals appear in the trading numbers of the stock market, but then again, the reasons for their existence do not affect their utility. The reality is that fractals repeat and can be used to gauge possible scenarios in the future. Their existence may have something to do with the consistent nature of human behavior; en masse, humans tend to repeat the same actions. It goes hand in hand with the effect that investor sentiment consistently has on stock markets.
In two previous SA articles (here and here), we compared both the broad and the close-up views of the fractals present in the “Tech Bubble” of 1999-2000 to the present bull market. In this piece, we revisit the two markets and see where we stand now that the anticipated correction has arrived.
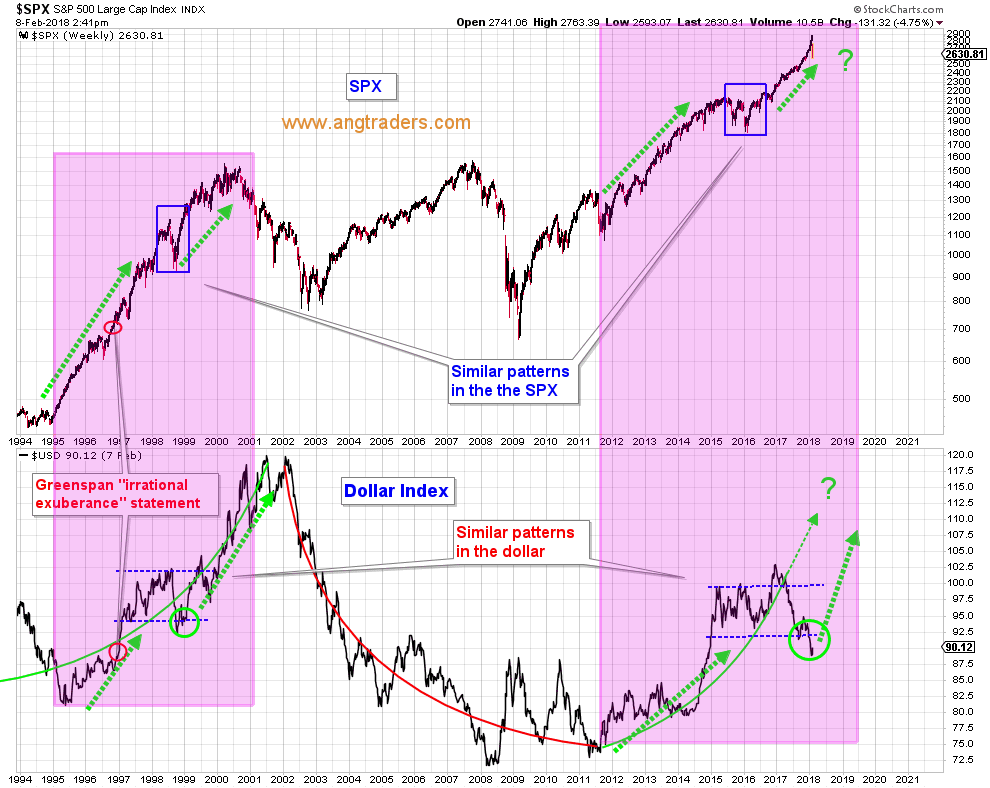
The pink rectangles on the chart below, show the similar trading patterns of the S&P 500 and the dollar index between 1995-2000, and 2012 until the present. In both time frames, the SPX and the dollar rose in tandem before the dollar entered a trading range (horizontal dotted lines on the chart), and the SPX experienced a double-bottom correction (blue rectangles on chart). The green circles on the dollar chart, highlight the similar “bottom bouncing” pattern exhibited by the dollar at the end of 1998 and 2017. The dollar may be setting up for a rally that mirrors what happened in 1999-2000 and which could, once again, take the S&P 500 to euphoric highs late in 2018 or early in 2019.
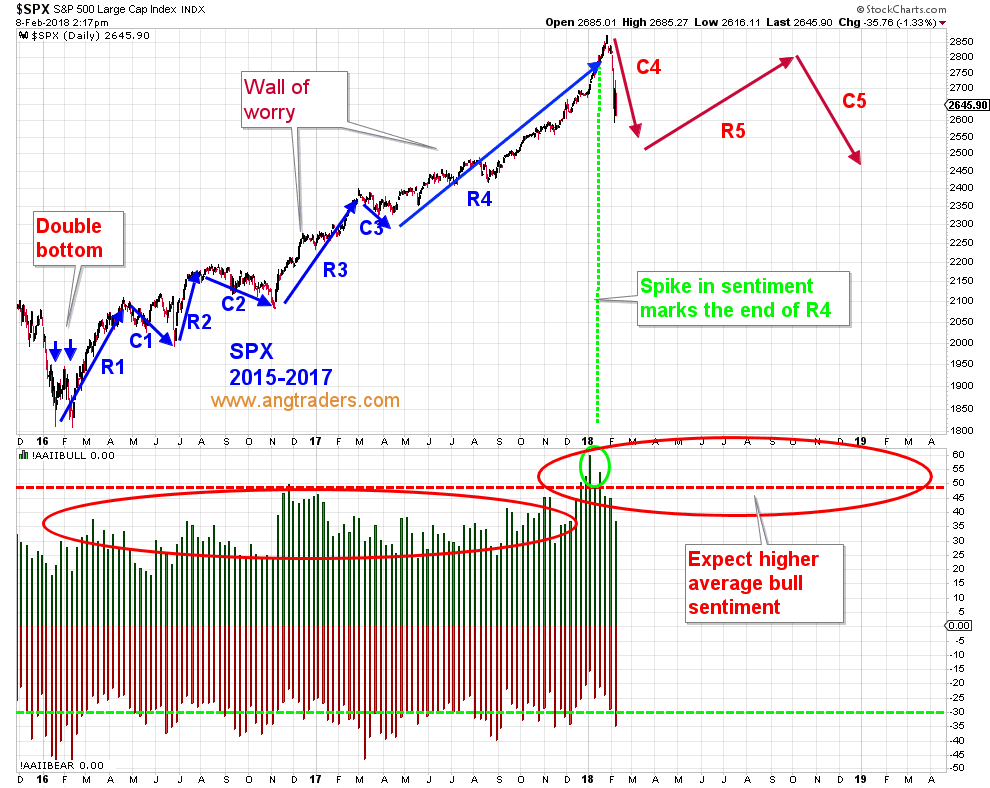
Market tops, both minor and major, tend to occur when bull sentiment is above 50% and bear sentiment is below 30%. While this correlation is a necessary condition for tops, it is not a sufficient condition. However, bull sentiment above 50% increases the likelihood of minor tops.
The first chart below shows the fractals from the tech rally along with the American Association of Individual Investors (AAII) sentiment survey results. Notice that the bull sentiment was generally lower prior to rally 3 (R3), and then generally higher after that (red ovals) as the market worked toward its euphoric major top late in 2000.
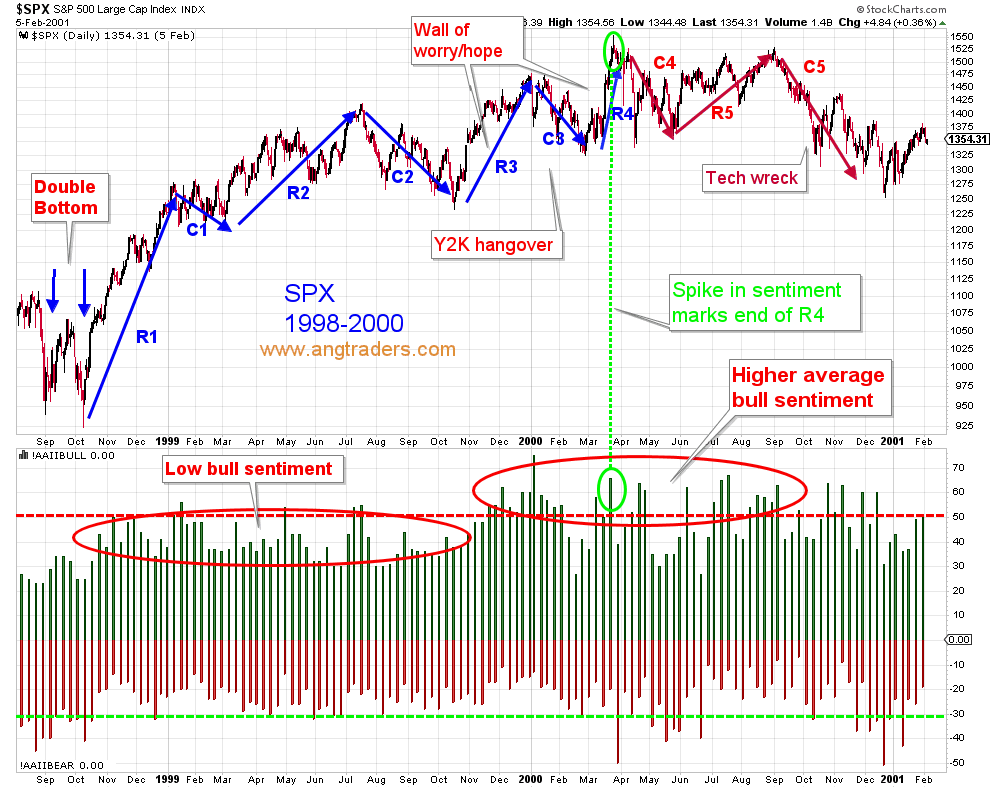
Notice that a spike in bull sentiment above 50% (green ovals in chart above) occurred just prior to the top of rally 4 (R4) in 2000, and that the bull sentiment spiked a few weeks ago (green ovals in chart below) leading up to the present correction.
Taking a closer look (chart below) at the 2000 correction (C4), we see that the SPX corrected 13% before bouncing strongly up to the 62% Fibonacci retrace level, then staying in a volatile trading range for the next six weeks before starting rally 5 (R5) which turned out to be the last rally of the tech bubble.