by UPFINA
The latest update shows Goldman’s basket of U.S. retail investors’ favorite stocks are up 85.9% year to date which is destroying the S&P 500 which is up just 14.2%. Words can’t explain how unusual this is. Only in the 1990s did retail investors do so well. Because words can’t do it justice, we have the chart below which shows the 20 year annualized return of the average investor is 2.3%. Those are negative real returns. Keep in mind the chart is slightly dated, but demonstrates the point nonetheless.
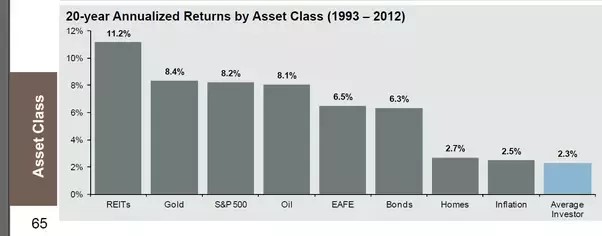
Retail investors usually don’t beat the index or earn any real returns for that matter. Of course, just because the retail favorites have done well this year doesn’t mean everyone has been a winner. Some investors panicked in March and some lost it all betting on options. We are seeing survivorship bias in play when most of the people bragging about their 2020 performance on social media had triple digits gains in 2020.
The is a SPAC market not a stock market. About 300 SPACs have gone public in the past couple years. It’s possible at the latest rate that we could have 1,000 by the end of 2022. There are only about 4,000 stocks traded in America. It’s funny because in the past few years we have talked about the decline in stocks listed. There has been a worry that the power in the economy has become too centralized. These SPACs aren’t really doing anything to change this because they mostly lose money. The economic profits still go to the internet giants. In 2019, there were only 59 SPACs. In the past 4 days, there have been 40 new SPACs. There were 9 on Wednesday. This is what will cause the end of the bull market in speculative stocks. Supply always beats demand in bubbles.
Pilgrim Baxter & Associates
Some people still don’t think the 2nd half 2020 is like the 1990s stock market bubble. We will keep going with this comparison until the bubble ends. Bubbles never end in a plateau, but some think that’s possible because they have recency bias. Back in 1997, there was a firm called Pilgrim Baxter and Associates which rode the momentum wave. Don Phillips of Morningstar stated, “Pilgrim Baxter caught wave after wave: momentum investing, investors chasing performance, instant mass distribution from Schwab OneSource. They got phenomenally lucky, but instead of being grateful, they kept pushing the envelope.”
ARK Innovation ETF, AUM…
Dec 2015: $8.2 million
Dec 2016: $12 million
Dec 2017: $376 million
Dec 2018: $1.1 billion
Dec 2019: $1.9 billion
Dec 2020: $18.4 billion$ARKKData via @ycharts pic.twitter.com/KthCtHxhVr
— Charlie Bilello (@charliebilello) December 23, 2020
Schwab OneSource sounds like nothing compared to the rise in popularity of free stock trading apps in the past few years. There has also been a rise in actively managed ETFs led by ARK Invest. As you can see from the chart above, ARK Invest’s innovation fund has seen a parabolic rise in assets under management. Investors are chasing growth stocks without a care for valuations.
A 2004 article from Fortune states, “They flooded PBHG’s toll-free lines with 80,000 calls a month, looking to plunk their money into its funds. Reporters paraded in to interview Pilgrim. Staffers constantly broke out the bubbly to celebrate milestones: $5 billion in assets, $10 billion, $20 billion.” 80,000 phone calls are a pittance compared to the popularity ARK has. ARK’s YouTube channel has 165,000 subscribers. Bloomberg’s interview with the founder of ARK, Cathie Wood, has 592,000 views in 6 days. ARK is getting a flood of new money it must invest. There is no way of closing an actively managed ETF like there is for mutual funds. Even though these growth stocks and funds have done very well, history tells us that popularity is highest at the top.
Unprofitable Stocks Soar
The worst businesses have had the best stocks this year if you measure the bad businesses by their lack of profitability, high short interest, and the amount they dilute shareholders. Usually, investors hate dilution, but in 2020, they love it. Shrinking share counts are supposed to be a good thing, but traders want to be diluted in 2020 because they think the money raised will go to new exciting developments which will grow sales further.
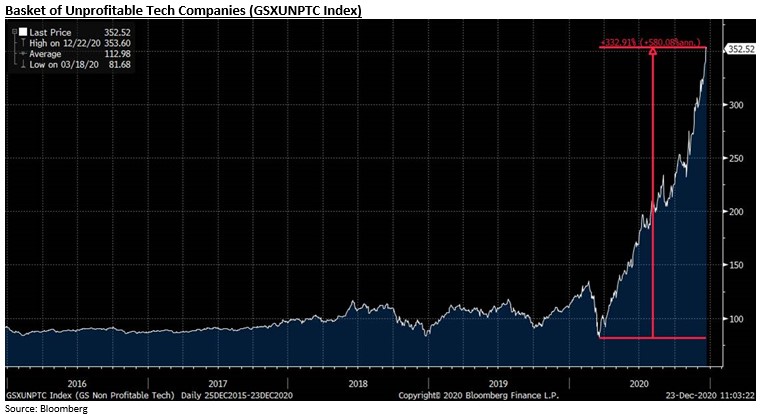
As you can see from the chart above, unprofitable tech stocks have risen 333% from the bottom in March. The investors and fund managers who cared about valuations are long gone. Money chases performance.
Very Overbought Small Caps
The Russell 2000 is the most overbought ever. In the past couple months, value stocks have done well. Growth stocks are in a bubble and value stocks are overbought. There isn’t much of a place to hide in this market.
As you can see from the chart below, the Russell 2000 is 34% above its 200 day moving average which is the highest going back to 1980. This isn’t usually a sign of a disaster though. Plus, the index is breaking out of a 3 year bear market. This looks like the emerging markets index which is close to its highest level in a decade. You wouldn’t expect the Nasdaq 100 to be doing so well with these former laggards turning into leaders.
Historic momentum surge for small-caps pic.twitter.com/yqEMW6tmir
— Strategas (@StrategasRP) December 23, 2020
As you can see from the chart below, only 56.8% of stocks in the Russell 2000 had an operating profit in the past year and 51% had EPS profits. Usually, a significant amount of the index isn’t profitable, but obviously this is a particularly bad time because we are coming out of a recession. Most of the energy firms in this index are obviously in major trouble. Don’t focus on the past though. Investors are pricing in a cyclical recovery in 2021 as 1 million vaccines have gone out and more are on the way in January.
Only about half of the Russell 2000 has EPS or operating income profits over the last 12 months.
Read more in tonight's Closer: https://t.co/6dWxr78ZcP pic.twitter.com/sB0WeConFf— Bespoke (@bespokeinvest) December 23, 2020
Conclusion
Retail investors usually don’t do well, but this year is another situation altogether. Many are seeing triple digit gains. ARK Invest is benefiting the most from this mania. Unprofitable stocks are beloved as sales growth matters more than profits. The Russell 2000 is the furthest above its 200 day moving average than ever before. Almost half of the small cap index didn’t make a profit in the past 12 months because of the recession.