Do you see the forgetfulness that people seem to have? Every single time.
“When the yield curve starts to flatten out, traders start wetting the bed” – David Quintieri
There have been countless indicators which show in the previous cycles, once something hits a particular level, the market crashes. It keeps happening. Every single time, people are in denial. But the market is ruthless. People learn lessons and then immediately forget. Well little goldfish, can’t say you weren’t warned.
https://www.tcw.com/en/Insights/Economics/04-12-18_Trading_Secrets
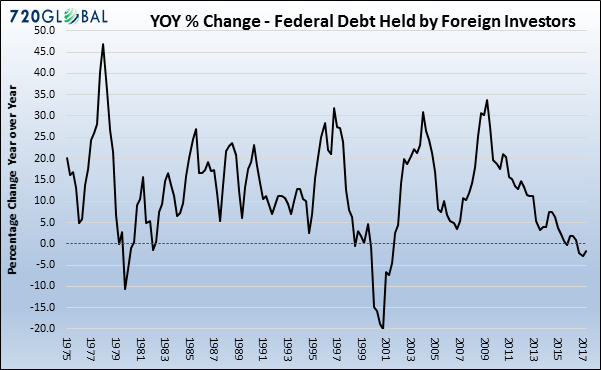
4-debt-by-foreign-investors.png (601×370)
http://realinvestmentadvice.com/wp-content/uploads/2018/04/4-debt-by-foreign-investors.png
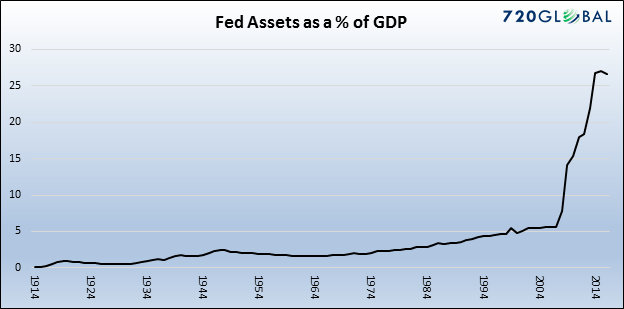
5-debt-as-assets.png (624×309)
http://realinvestmentadvice.com/wp-content/uploads/2018/04/5-debt-as-assets.png
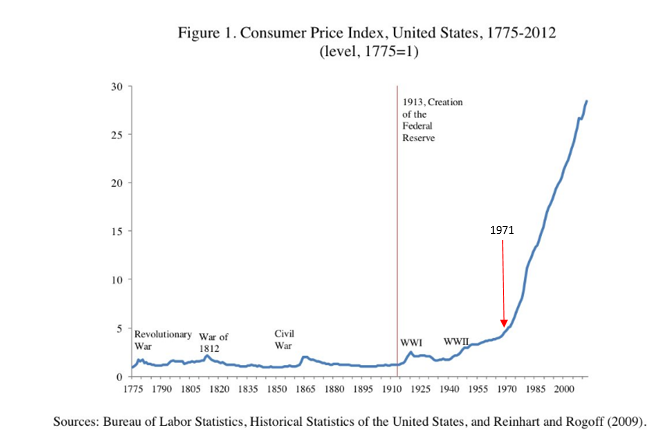
3-with-arrow.png (665×437)
http://realinvestmentadvice.com/wp-content/uploads/2018/04/3-with-arrow.png
chart2_0.jpg (500×309)
https://www.zerohedge.com/sites/default/files/inline-images/chart2_0.jpg?itok=HgPCwyWd
As Toys R Us Fails, the Retail Real Estate Glut Is Getting Worse – Bloomberg
- State lotteries: profits U.S. 2016 | Statistic
https://www.statista.com/statistics/215280/profits-of-us-state-and-provincial-lotteries/