Wolf Richter wolfstreet.com, http://www.amazon.com/author/wolfrichter
No, it’s not Seattle. Denver is by far #1. New York isn’t even in the top 25. And it explains why rents in Chicago are collapsing.
We’re going to shake up the status quo of apartment construction reporting. First, we’re going to lay out the status quo – the classic way of looking at this, the way you typically see it, where the New York metro comes out invariably as #1.
And then we’re going to look at it by population size of the metro, for metros with over one million people. And boy, do we get surprises.
For the past few years, there has been a multi-family construction boom across the US. About 283,000 new apartments are expected to be completed by the end of 2018, just a bit below last year when apartment deliveries hit a 20-year record of 317,872 units.
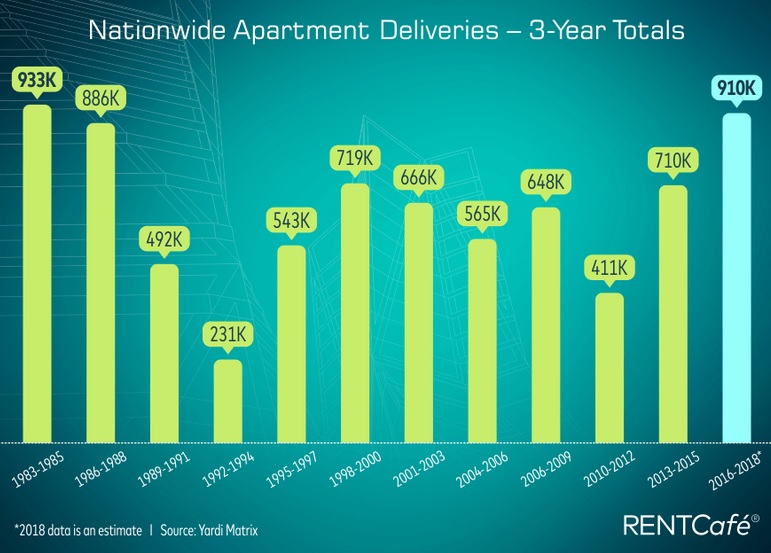
Over the three years 2016-2018 – this eliminates some of the year-to-year volatility – deliveries are projected to hit 910,000 apartments, according to RentCafé, a division of Yardi. This will be the highest three-year total since the all-time record of 1983-1985 (933,000).
“As the market is approaching a saturation point, 2018 may mark the start of a construction cooldown for the next few years,” according to RentCafé.
Boom and bust: In the chart below, note the multi-year 75% collapse of deliveries following the red-hot boom of the mid-1980s (click to enlarge):
The chart below shows the top 20 Metropolitan Statistical Areas (MSAs, large multi-city agglomerations as defined by the Census Bureau) in terms of total projected apartment supply. The New York metro is undisputed #1 with 19,948 apartments to be delivered this year:
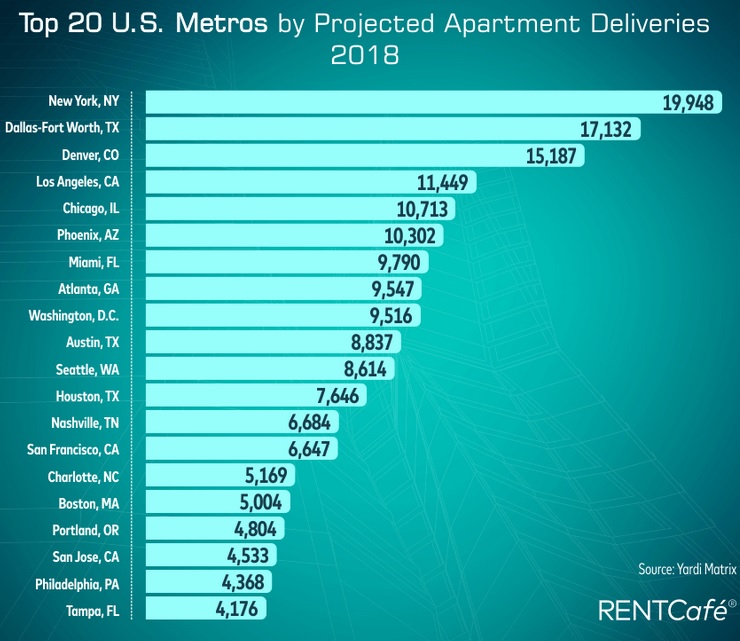
This is the classic look. It always shows some of the largest US metros near the top, with New York as #1. Part of the reason they rank so high is because they’re very large. The New York metro – officially “New York-Newark-Jersey City, NY-NJ-PA” – has 20.3 million inhabitants as of 2017 Census estimates. The metro of Los Angeles-Long Beach-Anaheim has 13.4 million inhabitants. Dallas-Fort Worth-Arlington has 7.4 million folks. But Denver-Aurora-Lakewood has only 2.9 million folks — yet it’s #3 even on this list. That set us a-thinking….
So I added the population figures from the Census Bureau to the mix, along with the estimated apartment deliveries for 2018 from the Yardi Matrix data. The result is the number of apartments to be delivered per 100,000 inhabitants. And suddenly a different picture emerges.
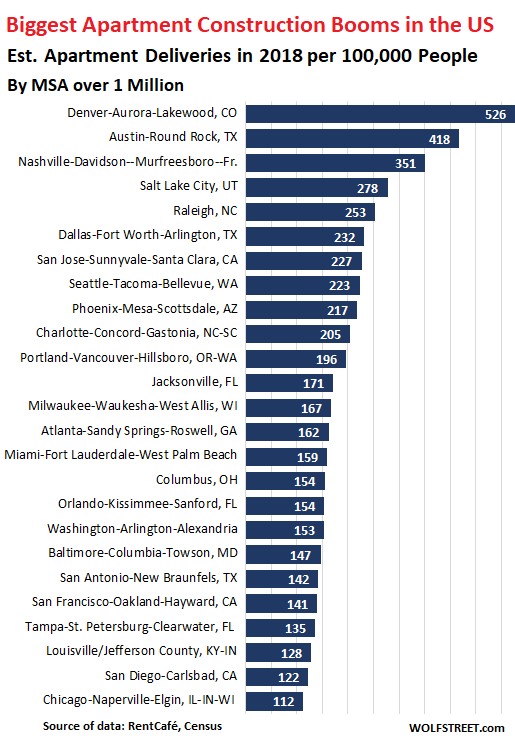
The chart below shows only metros with a population of over 1 million, sorted by apartment deliveries per 100,000 inhabitants. This is my list of the 25 biggest apartment-construction booms.
- New York metro disappears from this list, with only 98 apartments to be delivered per 100,000 inhabitants
- Denver metro is by far #1 with 526 apartments to be delivered per 100,000 inhabitants
- Austin metro is #2 with 418 apartments to be delivered per 100,000 inhabitants.
- Seattle metro, the often-cited queen of the apartment construction boom, is #8.
- The five-county San Francisco metro is #21.
One metric is missing from these dynamics: population growth or shrinkage. And it makes a difference. Look at Chicago.
The Chicago metro is in 25th place, with 10,700 apartment deliveries expected in 2019, for a population of 9.53 million. And this is a problem.
The Chicago metro has lost 27,000 people since its population peak in 2014 (9.56 million). In late 2015, asking rents peaked. Since then, with new apartment supply flooding the metro every year, and with the population shrinking at the same time, the median asking rent for a one-bedroom apartment has collapsed by 27% and for a two-bedroom by 32%.
An apartment boom that runs into a declining population ends with rents collapsing. This is a particular threat to the most expensive metros, such as San Francisco, where many people are fleeing the high costs of living every year. Only new influx from the US and overseas, mostly Asia, keeps the party going. But if there is a hiring slowdown, San Francisco too will experience population decline – which it does during every bust as people are fleeing to cheaper pastures, and the influx suddenly stops, and rents come down. Boom and bust. Always.
The table below shows the largest 99 MSAs in order of apartment deliveries per 100,000 inhabitants. But this list includes much smaller metros than the chart above. For example, New York metro with 20.3 million people and nearly 20,000 apartment deliveries is #58 on this list, just below the metro of Fort Wayne, IN, with 435,000 souls and 433 apartment deliveries, or 100 deliveries per 100,000 inhabitants. You can use the search function in your browser to find specific MSAs:
| MSAs | Population | Apt. Supply | Per 100K Pop. | |
| 1 | Denver-Aurora-Lakewood, CO | 2,888,227 | 15,187 | 526 |
| 2 | Austin-Round Rock, TX | 2,115,827 | 8,837 | 418 |
| 3 | Nashville-Davidson–Murfreesboro–Franklin, TN | 1,903,045 | 6,684 | 351 |
| 4 | Logan, UT-ID | 138,002 | 438 | 317 |
| 5 | Tallahassee, FL | 382,627 | 1,173 | 307 |
| 6 | Salt Lake City, UT | 1,203,105 | 3,339 | 278 |
| 7 | Wilmington, NC | 288,156 | 794 | 276 |
| 8 | Durham-Chapel Hill, NC | 567,428 | 1,485 | 262 |
| 9 | Raleigh, NC | 1,335,079 | 3,383 | 253 |
| 10 | Dallas-Fort Worth-Arlington, TX | 7,399,662 | 17,132 | 232 |
| 11 | Charleston-North Charleston, SC | 775,831 | 1,789 | 231 |
| 12 | San Jose-Sunnyvale-Santa Clara, CA | 1,998,463 | 4,533 | 227 |
| 13 | Seattle-Tacoma-Bellevue, WA | 3,867,046 | 8,614 | 223 |
| 14 | Corpus Christi, TX | 454,008 | 1,006 | 222 |
| 15 | Phoenix-Mesa-Scottsdale, AZ | 4,737,270 | 10,302 | 217 |
| 16 | Reno, NV | 464,593 | 994 | 214 |
| 17 | Spokane-Spokane Valley, WA | 564,236 | 1,207 | 214 |
| 18 | Charlotte-Concord-Gastonia, NC-SC | 2,525,305 | 5,169 | 205 |
| 19 | Boulder, CO | 322,514 | 642 | 199 |
| 20 | Portland-Vancouver-Hillsboro, OR-WA | 2,453,168 | 4,804 | 196 |
| 21 | Columbus, GA-AL | 303,811 | 541 | 178 |
| 22 | Boise City, ID | 709,845 | 1,260 | 178 |
| 23 | Des Moines-West Des Moines, IA | 645,911 | 1,130 | 175 |
| 24 | Fort Collins, CO | 343,976 | 600 | 174 |
| 25 | Jacksonville, FL | 1,504,980 | 2,576 | 171 |
| 26 | Gainesville, FL | 284,687 | 487 | 171 |
| 27 | Provo-Orem, UT | 617,675 | 1,048 | 170 |
| 28 | Olympia-Tumwater, WA | 280,588 | 476 | 170 |
| 29 | Milwaukee-Waukesha-West Allis, WI | 1,576,236 | 2,627 | 167 |
| 30 | Atlanta-Sandy Springs-Roswell, GA | 5,884,736 | 9,547 | 162 |
| 31 | Asheville, NC | 456,145 | 730 | 160 |
| 32 | Miami-Fort Lauderdale-West Palm Beach, FL | 6,158,824 | 9,790 | 159 |
| 33 | Madison, WI | 654,230 | 1,023 | 156 |
| 34 | Cape Coral-Fort Myers, FL | 739,224 | 1,145 | 155 |
| 35 | Columbus, OH | 2,078,725 | 3,209 | 154 |
| 36 | Orlando-Kissimmee-Sanford, FL | 2,509,831 | 3,857 | 154 |
| 37 | Washington-Arlington-Alexandria, DC-VA-MD-WV | 6,216,589 | 9,516 | 153 |
| 38 | Omaha-Council Bluffs, NE-IA | 933,316 | 1,425 | 153 |
| 39 | Baltimore-Columbia-Towson, MD | 2,808,175 | 4,117 | 147 |
| 40 | Mobile, AL | 413,955 | 599 | 145 |
| 41 | Waco, TX | 268,696 | 384 | 143 |
| 42 | Pensacola-Ferry Pass-Brent, FL | 487,784 | 695 | 142 |
| 43 | San Antonio-New Braunfels, TX | 2,473,974 | 3,501 | 142 |
| 44 | San Francisco-Oakland-Hayward, CA | 4,727,357 | 6,647 | 141 |
| 45 | Greenville-Anderson-Mauldin, SC | 895,923 | 1,215 | 136 |
| 46 | Tampa-St. Petersburg-Clearwater, FL | 3,091,399 | 4,176 | 135 |
| 47 | Louisville/Jefferson County, KY-IN | 1,293,953 | 1,660 | 128 |
| 48 | Albany-Schenectady-Troy, NY | 886,188 | 1,124 | 127 |
| 49 | Little Rock-North Little Rock-Conway, AR | 738,344 | 914 | 124 |
| 50 | San Diego-Carlsbad, CA | 3,337,685 | 4,086 | 122 |
| 51 | Chicago-Naperville-Elgin, IL-IN-WI | 9,533,040 | 10,713 | 112 |
| 52 | Houston-The Woodlands-Sugar Land, TX | 6,892,427 | 7,646 | 111 |
| 53 | Grand Rapids-Wyoming, MI | 1,059,113 | 1,157 | 109 |
| 54 | Indianapolis-Carmel-Anderson, IN | 2,028,614 | 2,203 | 109 |
| 55 | Chattanooga, TN-GA | 556,548 | 591 | 106 |
| 56 | Boston-Cambridge-Newton, MA-NH | 4,836,531 | 5,004 | 103 |
| 57 | Fort Wayne, IN | 434,617 | 433 | 100 |
| 58 | New York-Newark-Jersey City, NY-NJ-PA | 20,320,876 | 19,948 | 98 |
| 59 | Minneapolis-St. Paul-Bloomington, MN-WI | 3,600,618 | 3,520 | 98 |
| 60 | Stockton-Lodi, CA | 745,424 | 716 | 96 |
| 61 | Ann Arbor, MI | 367,627 | 353 | 96 |
| 62 | Augusta-Richmond County, GA-SC | 600,151 | 576 | 96 |
| 63 | Baton Rouge, LA | 834,159 | 800 | 96 |
| 64 | Worcester, MA-CT | 942,475 | 871 | 92 |
| 65 | Santa Maria-Santa Barbara, CA | 448,150 | 399 | 89 |
| 66 | Cleveland-Elyria, OH | 2,058,844 | 1,781 | 87 |
| 67 | Los Angeles-Long Beach-Anaheim, CA | 13,353,907 | 11,449 | 86 |
| 68 | Lansing-East Lansing, MI | 477,656 | 400 | 84 |
| 69 | Savannah, GA | 387,543 | 318 | 82 |
| 70 | Syracuse, NY | 654,841 | 532 | 81 |
| 71 | Colorado Springs, CO | 723,878 | 570 | 79 |
| 72 | Knoxville, TN | 877,104 | 684 | 78 |
| 73 | Richmond, VA | 1,294,204 | 1,001 | 77 |
| 74 | St. Louis, MO-IL | 2,807,338 | 2,088 | 74 |
| 75 | Kansas City, MO-KS | 2,128,912 | 1,569 | 74 |
| 76 | Greensboro-High Point, NC | 761,184 | 556 | 73 |
| 77 | Las Vegas-Henderson-Paradise, NV | 2,204,079 | 1,597 | 72 |
| 78 | Philadelphia-Camden-Wilmington, PA-NJ-DE-MD | 6,096,120 | 4,368 | 72 |
| 79 | Deltona-Daytona Beach-Ormond Beach, FL | 649,202 | 453 | 70 |
| 80 | Sacramento–Roseville–Arden-Arcade, CA | 2,324,884 | 1,592 | 68 |
| 81 | Buffalo-Cheektowaga-Niagara Falls, NY | 1,136,856 | 755 | 66 |
| 82 | Winston-Salem, NC | 667,733 | 403 | 60 |
| 83 | Wichita, KS | 645,628 | 381 | 59 |
| 84 | Pittsburgh, PA | 2,333,367 | 1,326 | 57 |
| 85 | Oxnard-Thousand Oaks-Ventura, CA | 854,223 | 456 | 53 |
| 86 | Virginia Beach-Norfolk-Newport News, VA-NC | 1,725,246 | 910 | 53 |
| 87 | Oklahoma City, OK | 1,383,737 | 714 | 52 |
| 88 | Columbia, SC | 825,033 | 418 | 51 |
| 89 | Cincinnati, OH-KY-IN | 2,179,082 | 1,093 | 50 |
| 90 | Birmingham-Hoover, AL | 1,149,807 | 566 | 49 |
| 91 | Bridgeport-Stamford-Norwalk, CT | 949,921 | 450 | 47 |
| 92 | New Orleans-Metairie, LA | 1,275,762 | 602 | 47 |
| 93 | North Port-Sarasota-Bradenton, FL | 804,690 | 349 | 43 |
| 94 | Memphis, TN-MS-AR | 1,348,260 | 568 | 42 |
| 95 | Fresno, CA | 989,255 | 405 | 41 |
| 96 | New Haven-Milford, CT | 860,435 | 306 | 36 |
| 97 | Riverside-San Bernardino-Ontario, CA | 4,580,670 | 1,515 | 33 |
| 98 | Detroit-Warren-Dearborn, MI | 4,313,002 | 1,319 | 31 |
| 99 | Hartford-West Hartford-East Hartford, CT | 1,210,259 | 339 | 28 |