Wolf Richter wolfstreet.com, http://www.amazon.com/author/wolfrichter
A tiny cut in the prices-paid index did a $1-trillion job.
What the Bureau of Economic Analysis released today as part of its GDP report was a huge pile of revisions and adjustments going back to practically Adam and Eve. It included a tiny adjustment with one heck of a cumulative impact on “real” GDP, to the tune of nearly $1 trillion: It lowered further its already low measure of inflation.
So step by step. Based on this revised data pile, second-quarter “real” GDP (adjusted for inflation) increased at a seasonally adjusted annual rate of 4.1% from the prior quarter. Annual rate means that if GDP continues to increase for four quarters in a row at the current rate, the 12-month GDP growth would be 4.1%. This was the highest growth rate since Q3 2014:
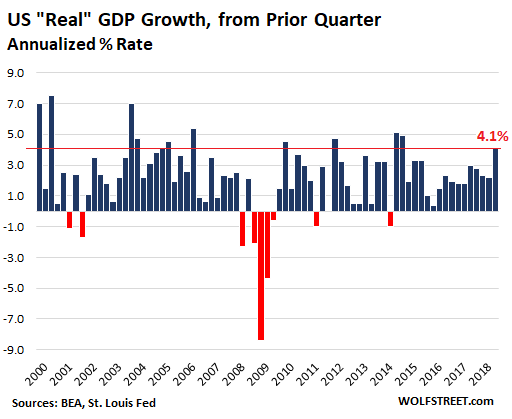
The above measure of “real” GDP – the change from prior quarter, but at an annualized rate – is the most volatile measure, producing the biggest-looking results, both up and down, as you can see in the above chart with a plunge of -8.4% in Q4 2008.
A less volatile measure and producing less big-looking results is the 12-month change in “real” GDP, which the BEA’s data set also provides. This is the inflation adjusted, seasonally adjusted annual rate of GDP growth – in other words, how GDP did over the past 12 months. For the 12 months ending in Q2, it rose 2.8%.
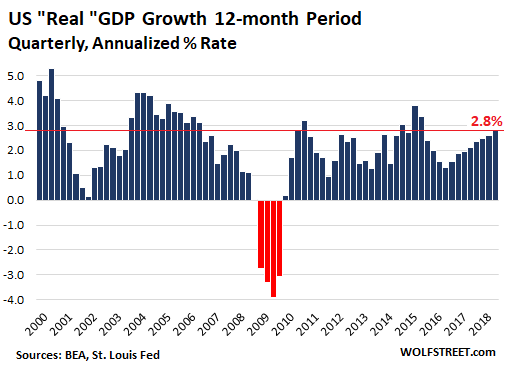
Note that for the worst 12-month period, ending in Q2 2009, “real” GDP fell -3.9% (revised from a drop of 4.1% before today’s revisions), compared to the worst quarter’s plunge (first chart), in Q4 2008, of -8.4%.
But here’s the thing. The BEA also performed adjustments to the entire pile of GDP data and to classifications (summary is here). This happens about every five years. It says:
Comprehensive updates of the National Income and Product Accounts (NIPAs), which are carried out about every five years, are an important part of BEA’s regular process for improving and modernizing its accounts to keep pace with the ever-changing U.S. economy. Updates incorporate newly available and more comprehensive source data, as well as improved estimation methodologies. The timespan for this year’s comprehensive update is 1929 through the first quarter 2018.
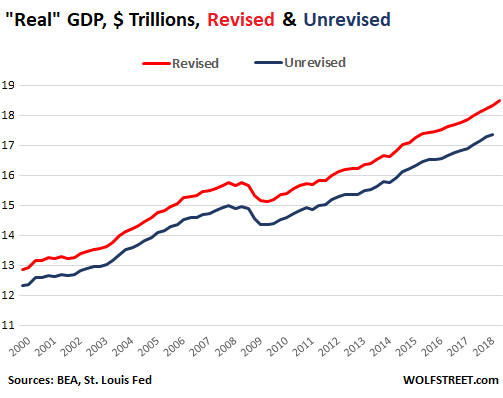
These revisions, updates, and adjustments are too numerous to dig through for a mere mortal. They impacted every little thing in the entire pile of national data. But one thing stood out, one tiny number that ended up increasing “real” GDP by nearly $1 trillion, from $17.37 trillion in Q1 (unrevised) to $18.32 trillion in Q1 (revised) – a difference of $952 billion.
This chart shows the new “real” GDP in trillion dollars (revised, red line) and the old “real” GDP (unrevised, blue line):
And the tiny number that caused this to happen? Inflation. Or rather, a reduction in the inflation index used for “real”GDP calculations. From the horse’s mouth, the BEA:
For 2012–2017, the average rate of change in the prices paid by U.S. residents, as measured by the gross domestic purchasers’ price index, was 1.2 percent, 0.1 percentage point lower than in the previously published estimates.
These adjustments to inflation go all the way back and are cumulative.
And that previous “average rate of change” in prices paid by consumers of 1.3% per year over the five years, was already ludicrously low, given the actual price increases experienced by most consumers. But now it has been reduced to just 1.2% over the five years.
A lower inflation rate used to deflate “nominal” GDP to get “real” GDP translates into higher “real” GDP. So the best way to make “real” GDP look better is by lowering the inflation measure used to deflate it from nominal GDP.
How much impact did that tiny adjustment to the prices-paid index have, and how much impact did all the other adjustments and revisions have?
To find out, I overlaid the revised and unrevised data of “nominal” GDP, which is not impacted by inflation adjustments. The chart below shows that the lines for revised and unrevised nominal GDP are essentially on top of each other:
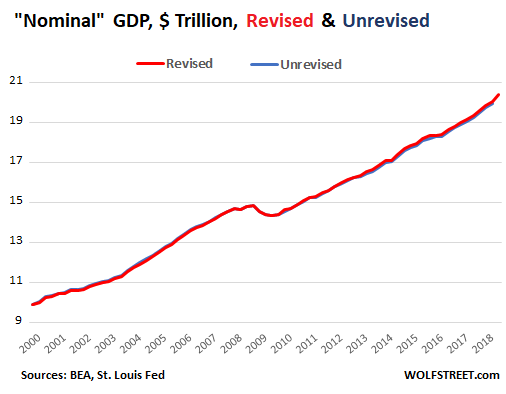
The fact that nominal GDP was barely impacted by any of the countless adjustments and revisions today, though “real” GDP jumped by nearly $1 trillion, shows that the only adjustments that really mattered for “real” GDP were the tiny downward revisions in the prices-paid index.
“Real” GDP is immensely impacted by the inflation measures used to “deflate” nominal GDP, and just one tiny adjustment in inflation over time has had a $1-trillion impact from one moment to the next. This is the kind of stuff that makes people doubt the meaningfulness of “real” GDP – though it’s the single most important summary measure of the overall economy.