by howmuch
Last week President Trump announced a landmark new trade agreement replacing NAFTA, a deal that he thinks will pour “cash and jobs” into the US economy. We don’t want todebate the merits of Trump’s approach to trade, but the world should always pay attention when the leader of the world’s largest economy starts talking about tariffs. Our newest visualization highlights exactly how big the U.S. economy is compared to the every other country in the world.
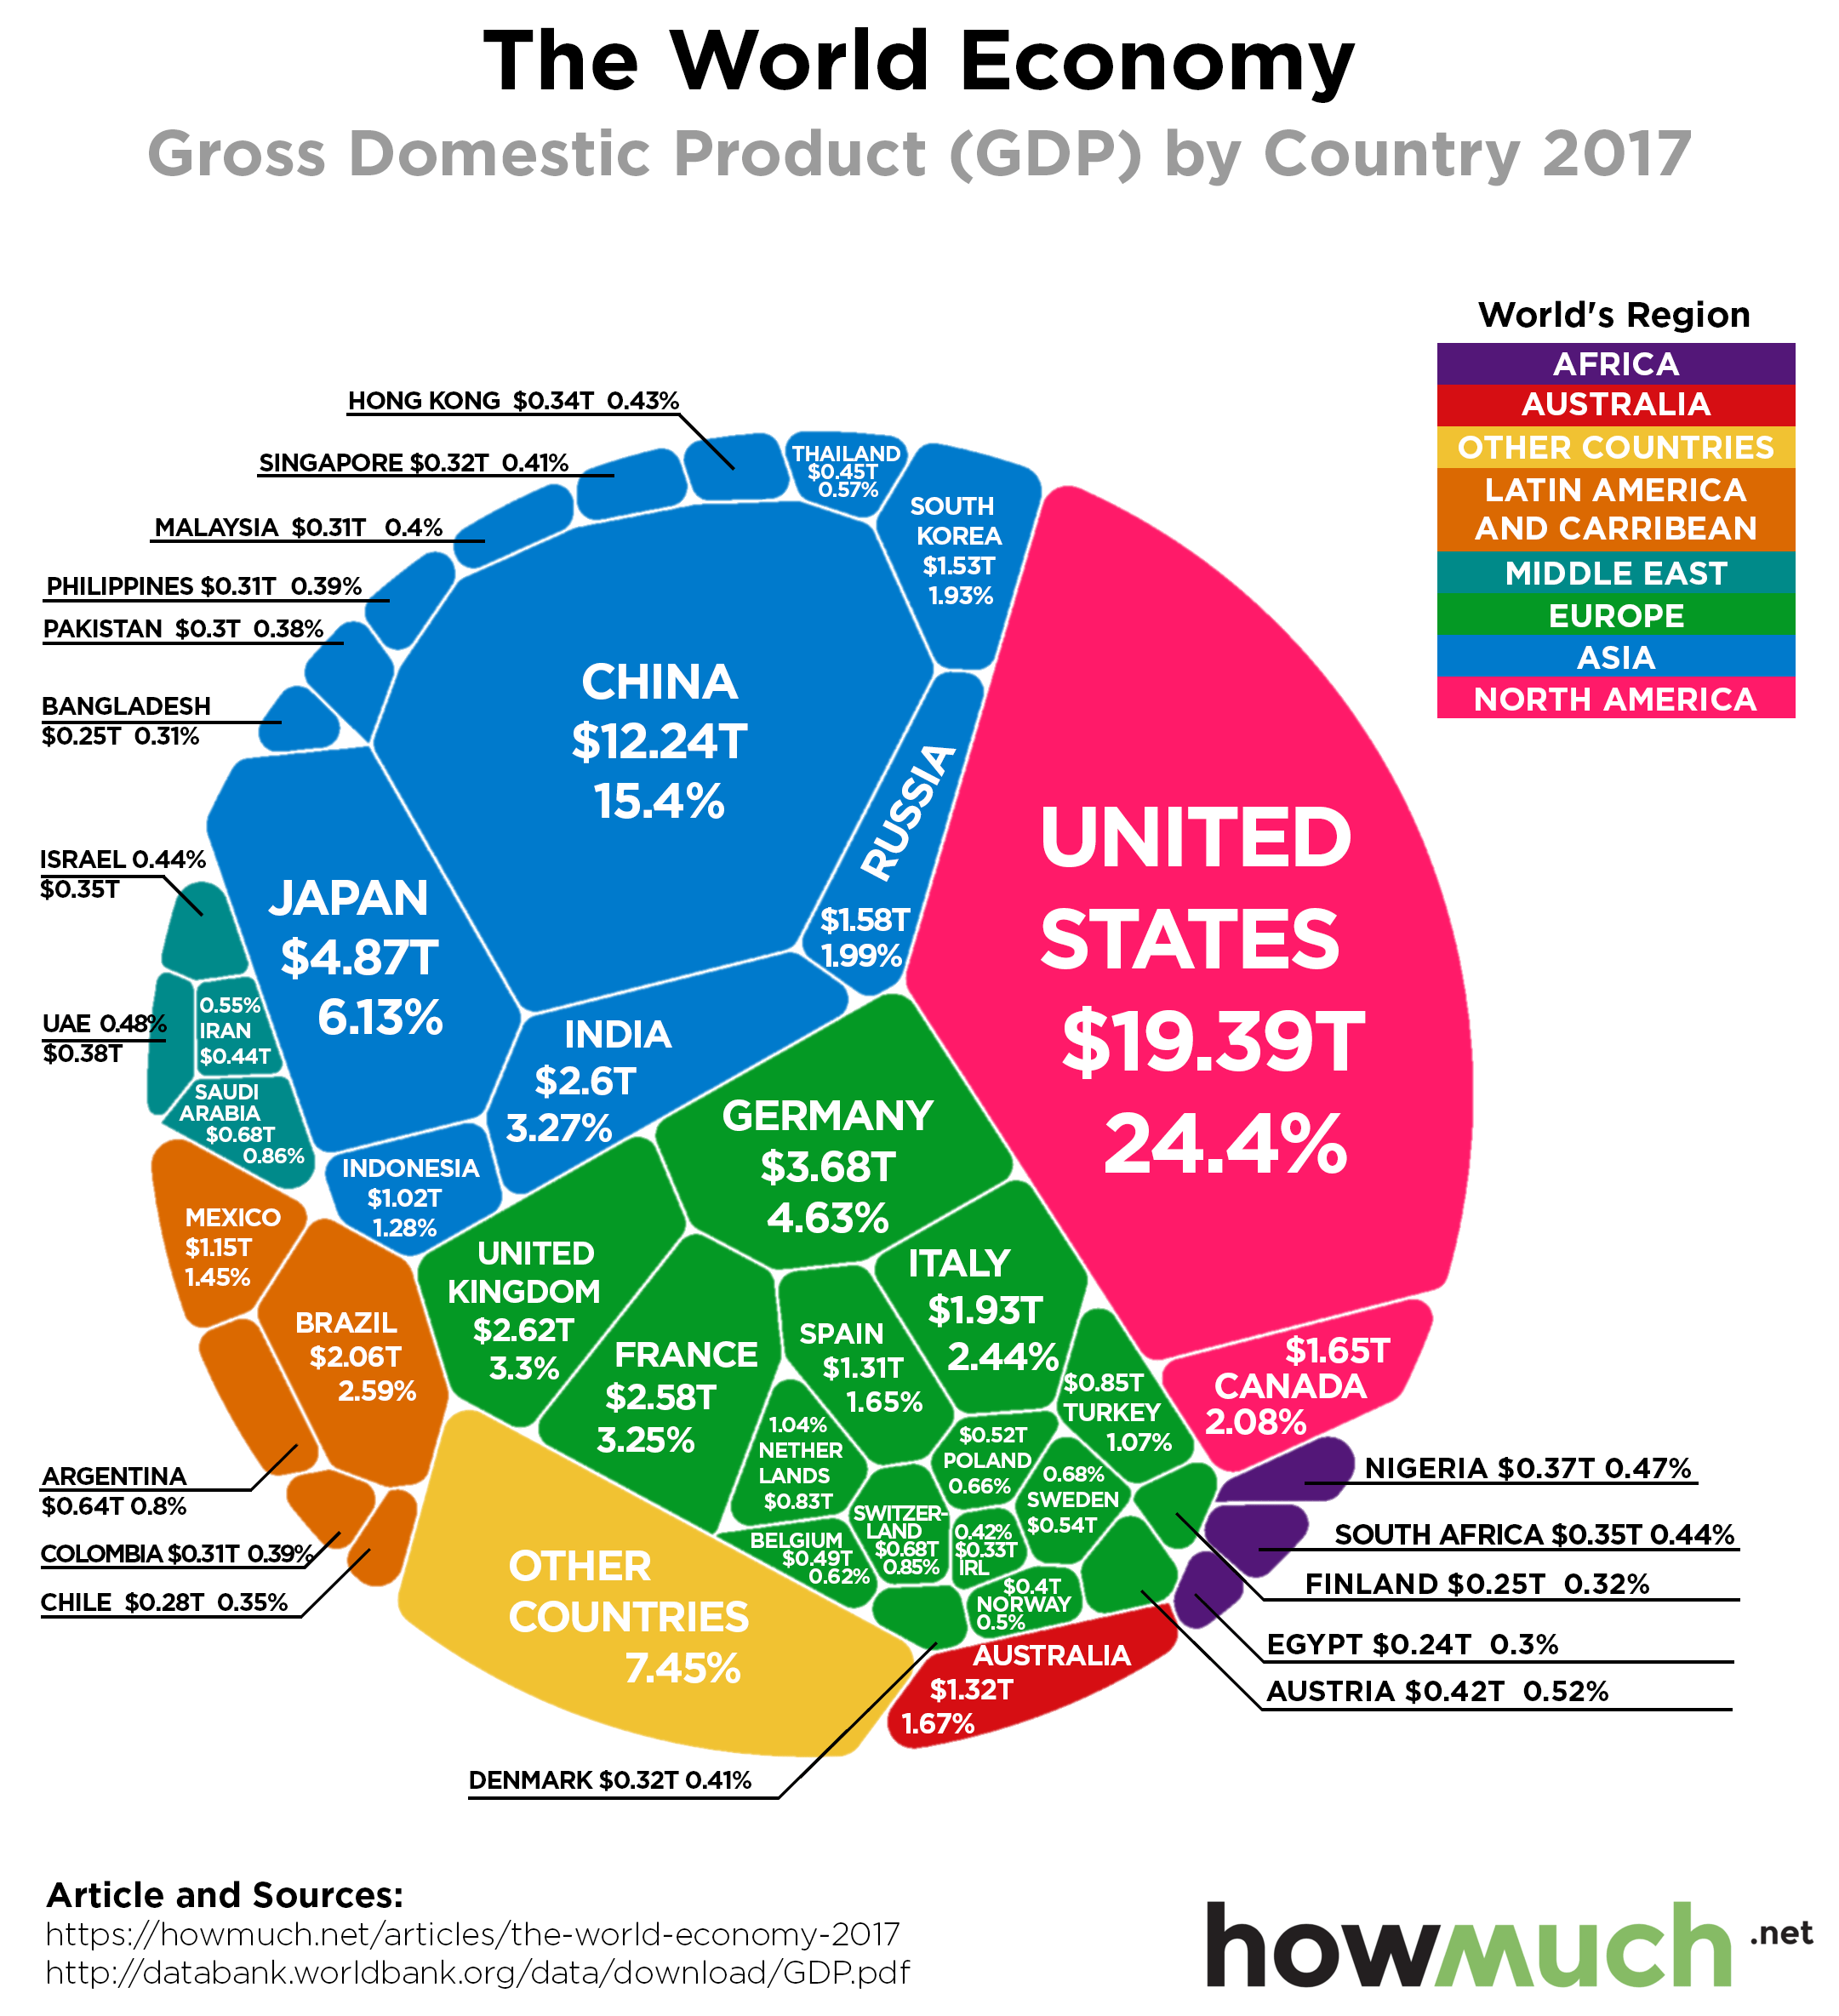
Our visualization neatly slices the latest 2017 GDP numbers from the World Bank, released on 21st of September 2018, a few different ways. The underlying idea is that GDP is not a zero-sum game, meaning the pie can continue to grow for every country in the world and not just a few. Each slice represents the total economic output, or GDP, of a country in 2017, the latest year for which definite and complete data are available. The color corresponds to its geographic location, and we included the percentage of the world’s economy each country makes up for easy references. This lets you immediately see which countries and continents dominate the world economy, and which ones lag way behind.
Top 10 Biggest World Economies by GDP
1. United States – $19.39 trillion
2. China – $12.24 trillion
3. Japan – $4.87 trillion
4. Germany – $3.67 trillion
5. UK – $2.62 trillion
6. India – $2.60 trillion
7. France – $2.58 trillion
8. Brazil – $2.05 trillion
9. Italy – $1.93 trillion
10. Canada – $1.65 trillion
An interesting way to understand these numbers is by comparing them to a previous visualization we did last year on the relative size of economies using the same underlying dataset from the World Bank. There are in fact a few changes to note. Looking at the top ten countries overall, India’s economy surpassed France to become the 6th biggest in the world. The UK was the only economy to shrink among the top ten, dropping from $2.86 trillion to $2.62 trillion, not adjusting for inflation. The U.S. is still the biggest both in overall terms and as a share of the global economy (24.32% last year vs. 24.40% this year). China is continuing to rise as a global economic power, accounting for 15.4% of the world’s GDP, up from 14.84%. In short and in general, the world’s heavyweight economies continue to reign supreme.
So how big are they? The combined GDP of the top four countries in the world (U.S., China, Japan and Germany) is greater than the entire rest of the world. The most obvious conclusion is that the U.S., Europe and Asia collectively control an enormous swath of the global economic order, totaling over 87% of the globe’s GDP. As you can see, the Global South barely makes it onto the visualization. Hundreds of countries contribute so little to the world’s GDP that we simply lumped them together into one uncategorized bucket, otherwise the visual would become too crowded.
That’s why every time President Trump threatens to increase tariffs on Chinese goods, theworld’s markets take him seriously. He’s not talking about small economies where trade deals have a only ripple effect around the world. Tariffs worth hundreds of billions in annual revenue would have a serious impact on the global economy. Whether you think the impact would be net positive or net negative is another matter altogether.
Data: Table 1.1