A Different Way To Look At Market Cycles
In this past weekend’s newsletter we noted the issues of similarities between the current market environment and previous market peaks in the past. To wit:
“It isn’t just the economy that is reminiscent of the 2007 landscape. As noted above, the markets also reflect the same. Here are a couple of charts worth reminding you of.
Notice that at the peaks of both previous bull markets, the market corrected, broke important support levels and then rallied to new highs leading investors to believe the bull market was intact. However, the weekly ‘sell signal’ never confirmed that rally as the ‘unseen bear market’ had already started.”
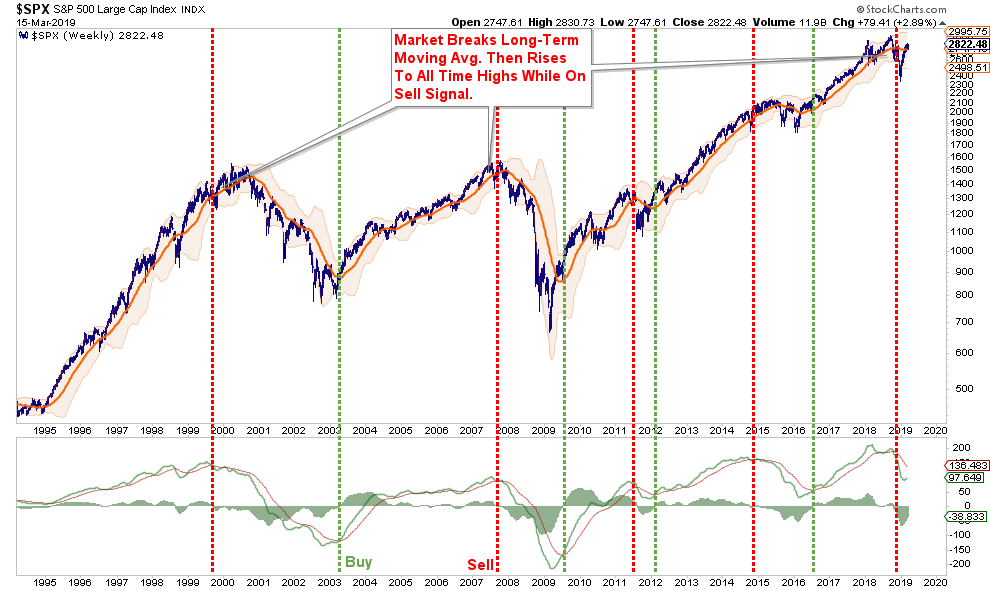
“Currently, relative strength as measured by RSI on a weekly basis has continued to deteriorate. Not only was such deterioration a hallmark of the market topping process in 2007, but also in 2000.”

“The problem of suggesting that we have once again evolved into a “Goldilocks economy” is that such an environment of slower growth is not conducive to supporting corporate profit growth at a level to justify high valuations.”
My friend and colleague Doug Kass penned an important note about the current market backdrop on Monday:
“‘Even apart from the instability due to speculation, there is the instability due to the characteristic of human nature that a large proportion of our positive activities depend on spontaneous optimism rather than mathematical expectations, whether moral or hedonistic or economic. Most, probably, of our decisions to do something positive, the full consequences of which will be drawn out over many days to come, can only be taken as the result of animal spirits-a spontaneous urge to action rather than inaction, and not as the outcome of a weighted average of quantitative benefits multiplied by quantitative probabilities.’ – John Maynard Keynes
The markets, confounding many, have vaulted higher from the Christmas Eve lows with nary a selloff.
This morning, let’s briefly explore the catalysts to the advance and consider what might follow:
- Liquidity (and financial conditions) have improved, as Central Bankers, to some degree, have reversed their tightening policies. Interest rates and inflationary expectations have moved lower than expected, providing hope for an elongated economic cycle that has already been a decade in duration and appeared to be “long in the tooth.”
- Market structure (and the dominance of price following products and strategies like ETFs, CTAs and Risk Parity and Volatility Trending/Targeting) exacerbated the trend lower into late-December. The breadth thrust and reversal in price momentum contributed to the post-Christmas rally. As I have previously noted, in an investment world dominated by the aforementioned products that worship at the altar of price momentum – ‘buyers live higher and sellers live lower.’ This phenomenon has exaggerated market moves and has created an air of artificiality and absence of price discovery (on both the upside and the downside).
- Corporate buybacks – abetted by tax reform introduced 15 months ago – provided another reason for a strong backdrop for higher stock prices.
- As a result of the above factors (and others) animal spirits rose and valuations expanded.
These four conditions have offset the deceleration in the rate of global economic growth and U.S. corporate profit growth.”
He is correct, the “animal spirits,” which were awakened by consecutive rounds of financial stimulus on a global scale, has enticed investors into the belief that all risks of a market cycle completion have been removed. The problem, as I have discussed previously, is this optimism comes at a point in history diametrically opposed to when President Reagan instituted many of the same conservative policies.
It is this exuberance that reminded me of the following “investor psychology” chart.
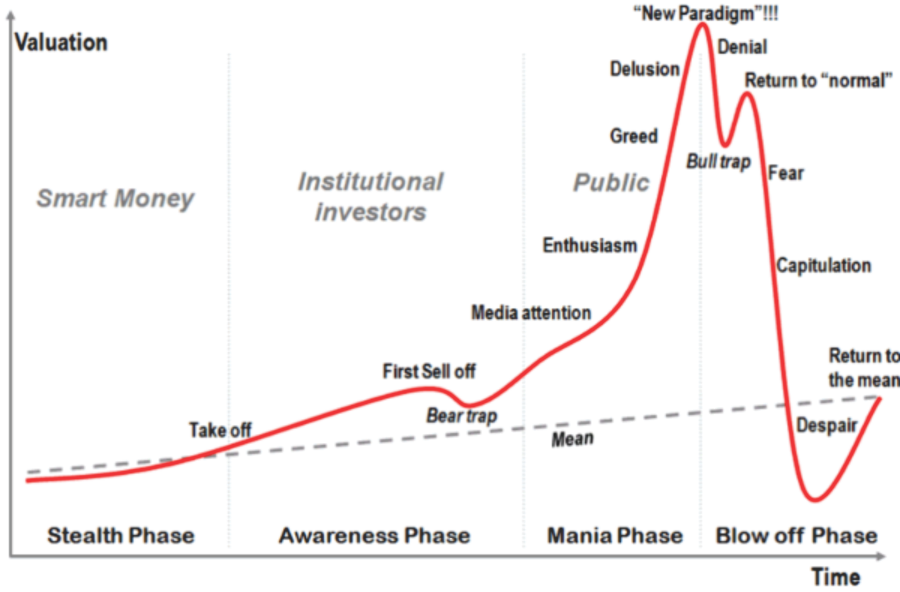
This chart is not new, and there are many variations similar to it, but the importance should not be lost on individuals as it is repeated throughout history. At each delusional peak, it was always uttered, in some shape, form or variation, “this time is different.”
Of course, to the detriment of those who fell prey to that belief, it was not.
As I was studying the chart, something struck me.
During my history of blogging and writing newsletters, I have often discussed the importance of full-market cycles.
“Long-term investment success depends more on the WHEN you start investing. This is clearly shown in the chart below of long-term secular full-market cycles.”
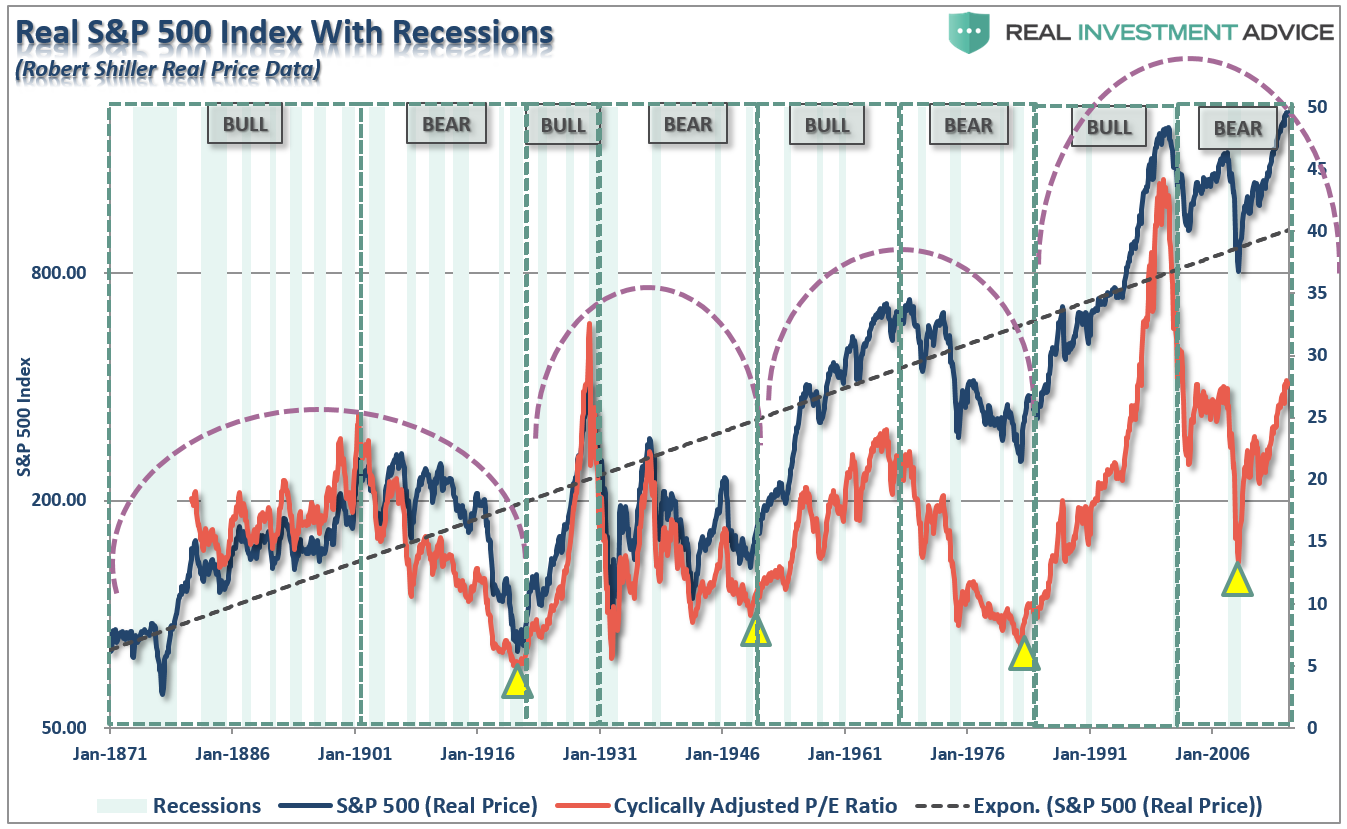
“Here is the critical point. The MAJORITY of the returns from investing came in just 4 of the 8 major market cycles since 1871. Every other period yielded a return that actually lost out to inflation during that time frame.”
By looking at each full-cycle period as two parts, bull and bear, I missed the importance of the “psychology” driven by the entirety of the cycle. In other words, what if instead of there being 8-cycles, we look at them as only three?
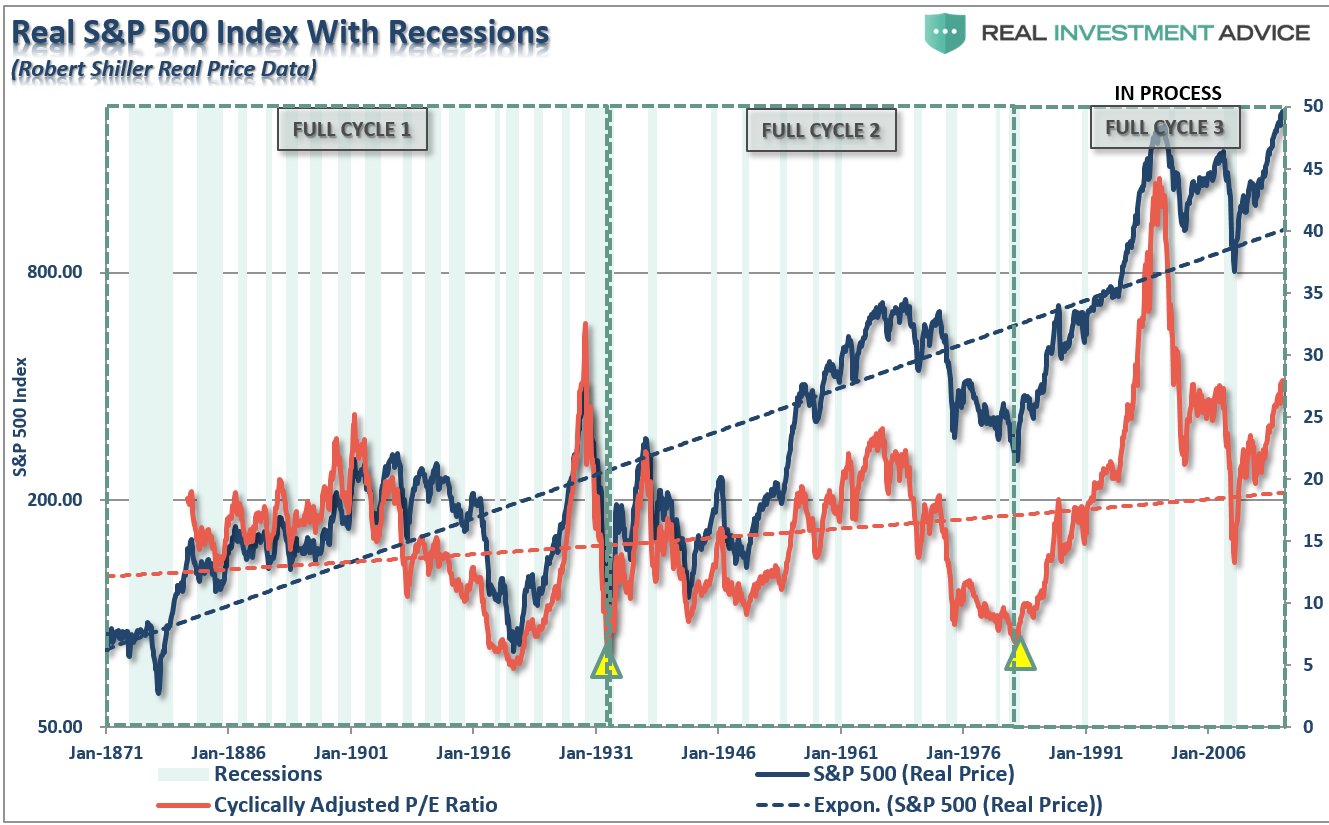
This would, of course, suggest that based on the “psychological” cycle of the market, the bull market that began in 1980 is not yet complete.
Notice in the chart above the CAPE (cyclically adjusted P/E ratio) reverted well below the long-term in both prior full-market cycles. While valuations did, very briefly, dip below the long-term trend in 2008-2009, they have not reverted to levels either low or long enough to form the fundamental and psychological underpinnings seen at the beginning of the last two full-market cycles.
Long-Run Psychological Cycles
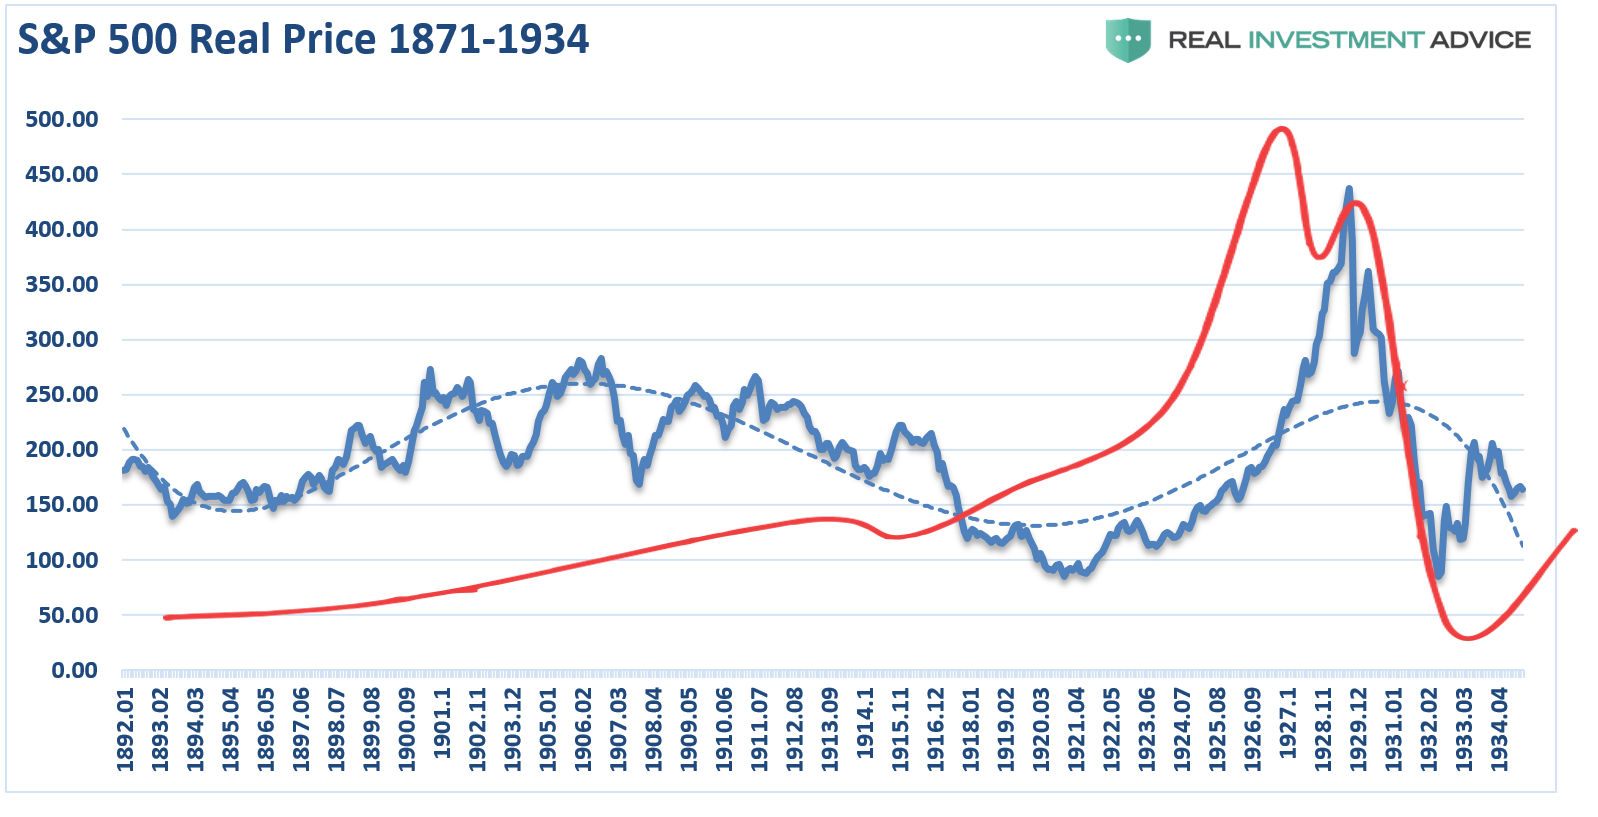
It is from that basis, and historical time frames, that I have created the following thought experiment of examining the psychological cycle overlaid on each of the three full-cycle periods in the market.
The first full-market cycle lasted 63-years from 1871 through 1934. This period ended with the crash of 1929 and the beginning of the “Great Depression.”
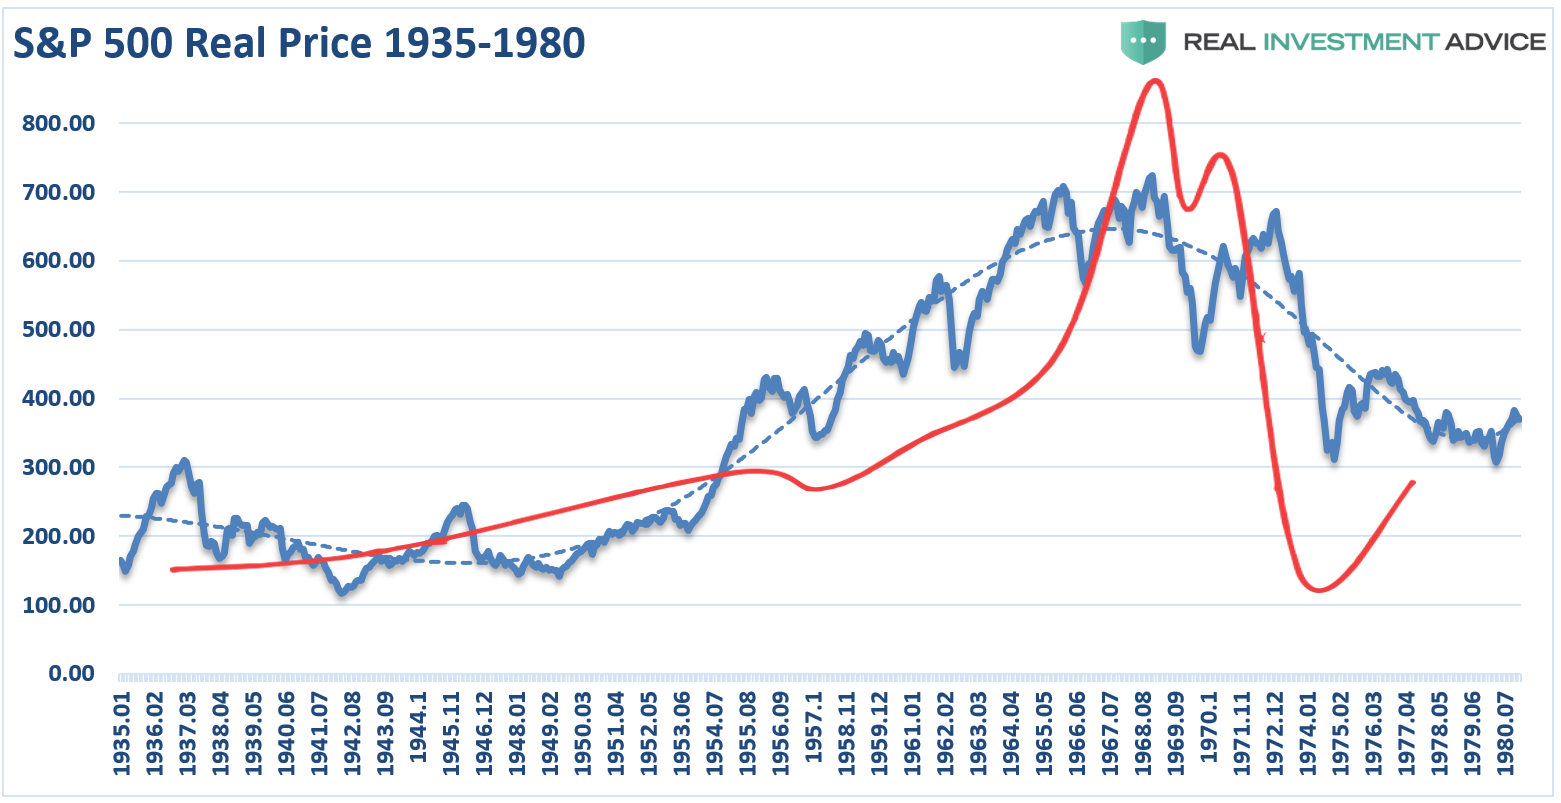
The second full-market cycle lasted 45-years from 1935-1980. This cycle ended with the demise of the “Nifty-Fifty” stocks and the “Black Bear Market” of 1974. While not as economically devastating to the overall economy as the 1929-crash, it did greatly impair the investment psychology of those in the market.
The third (current) full-market cycle is only 39-years in the making. Given the 2nd highest valuation levels in history, corporate, consumer and margin debt near historical highs, and average economic growth rates running at historical lows, it is worth questioning whether the current full-market cycle has been completed or not?
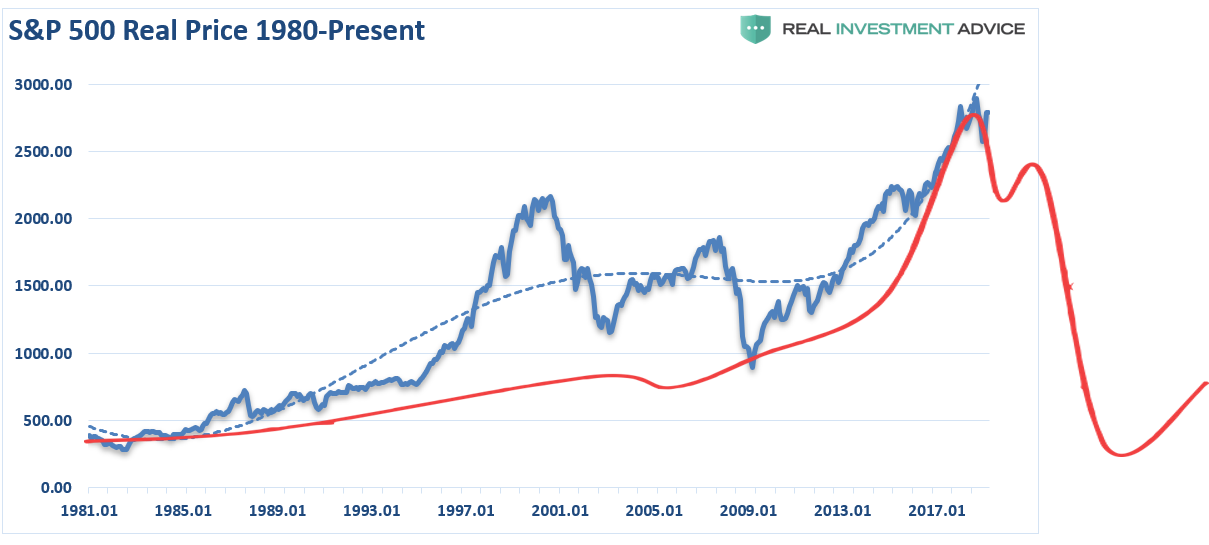
The idea the “bull market” which begin in 1980 is still intact is not a new one. As shown below, a chart of the market from 1980 to the present, suggests the same.
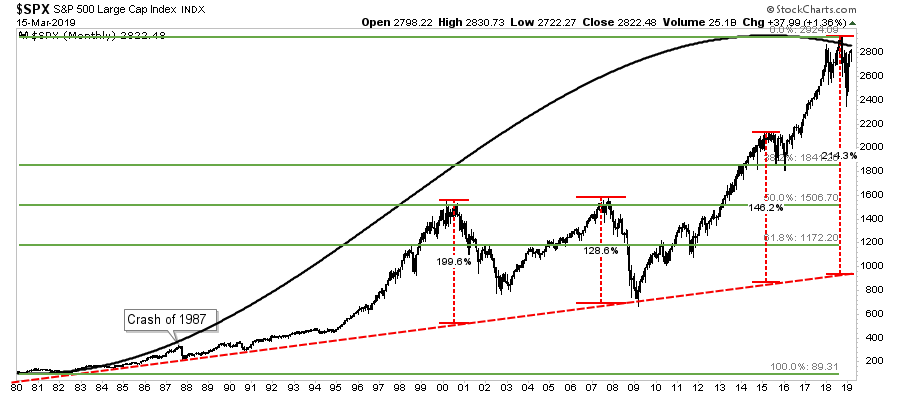
- The long-term bullish trend line remains
- The cycle-oscillator is only half-way through a long-term cycle.
- On a Fibonacci-retracement basis, a 61.8% retracement would almost intersect with the long-term bullish trend-line around 1200 suggesting the next downturn could indeed be a nasty one.
Again, I am NOT suggesting this is the case. This is just a thought-experiment about the potential outcome from the collision of weak economics, high levels of debt, and valuations and “irrational exuberance.”
It’s All Asymmetric
A second supporting theory of full market cycles was George Soros’ take on bubbles.
“First, financial markets, far from accurately reflecting all the available knowledge, always provide a distorted view of reality. The degree of distortion may vary from time to time. Sometimes it’s quite insignificant, at other times, it is quite pronounced. When there is a significant divergence between market prices and the underlying reality, there is a lack of equilibrium conditions.
I have developed a rudimentary theory of bubbles along these lines. Every bubble has two components: an underlying trend that prevails in reality and a misconception relating to that trend. When a positive feedback develops between the trend and the misconception, a boom-bust process is set in motion. The process is liable to be tested by negative feedback along the way, and if it is strong enough to survive these tests, both the trend and the misconception will be reinforced. Eventually, market expectations become so far removed from reality that people are forced to recognize that a misconception is involved. A twilight period ensues during which doubts grow and more and more people lose faith, but the prevailing trend is sustained by inertia. As Chuck Prince, former head of Citigroup, said:
‘As long as the music is playing, you’ve got to get up and dance. We are still dancing.’
Eventually, a tipping point is reached when the trend is reversed; it then becomes self-reinforcing in the opposite direction.
Typically bubbles have an asymmetric shape. The boom is long and slow to start. It accelerates gradually until it flattens out again during the twilight period. The bust is short and steep because it involves the forced liquidation of unsound positions.”
The chart below is an example of asymmetric bubbles.
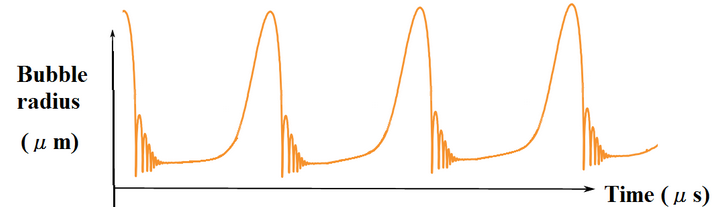
Soros’ view on the pattern of bubbles is interesting because it changes the argument from a fundamental view to a technical view. Prices reflect the psychology of the market which can create a feedback loop between the markets and fundamentals. As Soros stated:
“Financial markets do not play a purely passive role; they can also affect the so-called fundamentals they are supposed to reflect. These two functions, that financial markets perform, work in opposite directions. In the passive or cognitive function, the fundamentals are supposed to determine market prices. In the active or manipulative function market, prices find ways of influencing the fundamentals. When both functions operate at the same time, they interfere with each other. The supposedly independent variable of one function is the dependent variable of the other, so that neither function has a truly independent variable. As a result, neither market prices nor the underlying reality is fully determined. Both suffer from an element of uncertainty that cannot be quantified.”
The chart below utilizes Dr. Robert Shiller’s stock market data going back to 1900 on an inflation-adjusted basis. I then took a look at the markets prior to each major market correction and overlaid the asymmetrical bubble shape as discussed by George Soros.
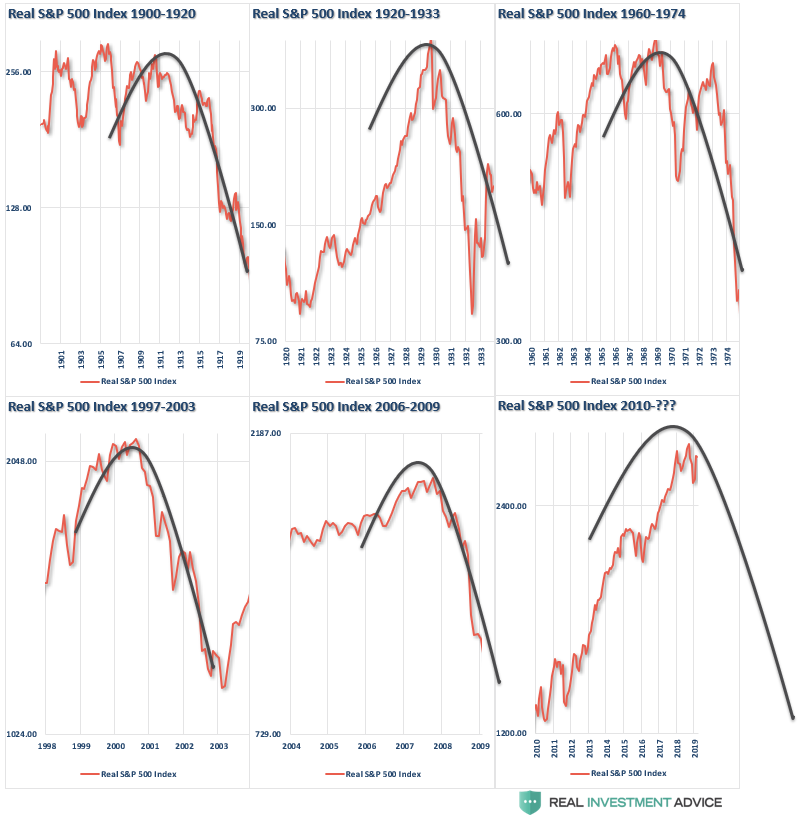 There is currently much debate about the health of financial markets. Have we indeed found the “Goldilocks economy?” Can prices can remain detached from the fundamental underpinnings long enough for an economy/earnings slowdown to catch back up with investor expectations?
The speculative appetite for “yield,” which has been fostered by the Fed’s ongoing interventions and suppressed interest rates, remains a powerful force in the short term. Furthermore, investors have now been successfully “trained” by the markets to “stay invested” for “fear of missing out.”
The increase in speculative risks, combined with excess leverage, leave the markets vulnerable to a sizable correction at some point in the future. The only missing ingredient for such a correction currently is simply a catalyst to put “fear” into an overly complacent marketplace.
In the long term, it will ultimately be the fundamentals that drive the markets. Currently, the deterioration in the growth rate of earnings, and economic strength, are not supportive of the current levels of asset prices or leverage. The idea of whether, or not, the Federal Reserve, along with virtually every other central bank in the world, are inflating the next asset bubble is of significant importance to investors who can ill afford to, once again, lose a large chunk of their net worth.
It is all reminiscent of the market peak of 1929 when Dr. Irving Fisher uttered his now famous words: “Stocks have now reached a permanently high plateau.” The clamoring of voices proclaiming the bull market still has plenty of room to run is telling much the same story. History is replete with market crashes that occurred just as the mainstream belief made heretics out of anyone who dared to contradict the bullish bias.
It is critically important to remain as theoretically sound as possible as a large majority of investors have built their portfolios on a foundation of false ideologies.
The problem is when reality collides with widespread fantasy.