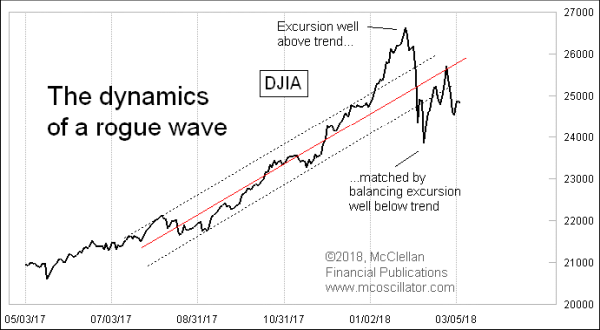
Back on Feb. 15, I wrote about “Stock Market In a Rogue Wave”. Rogue waves are a rare and peculiar phenomenon, both in the ocean and in other areas involving flow. The main points are that a rogue wave borrows energy from adjacent waves to build to a much greater height than the surrounding chop. And the height of the crest tends to be matched by the depth of the adjacent trough. After the rogue wave goes by, the fluid returns to the nominal level, or “sea level”, which in the stock market is harder to discern.
In the case of the DJIA’s rogue wave, the “sea level” equivalent is the trend which was in effect before the upward swoop and adjacent mini-crash. That trend is depicted by a median line shown in the top chart this week. The dead-cat bounce made it back almost exactly to the median line, and so the mission of the post rogue wave period has now been accomplished. What happens next is not part of this model of stock price behavior.
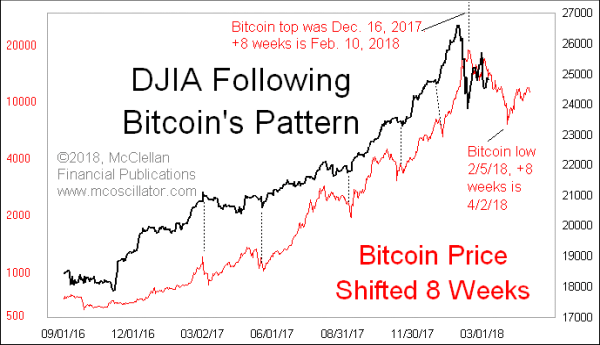
Back on Jan. 25, I wrote about “Finally, An Actual Use For Bitcoin” noting that the price pattern in Bitcoin during 2017 was getting replicated in the movements of the DJIA. Here is an update of that chart:

Right after I wrote that article, the pattern correlation broke down about as badly as it can, inverting to a DJIA bottom at the point when the Bitcoin price pattern said a top should occur. And then the DJIA rebounded, but in a way that makes it appear that the DJIA is working to get back on track with Bitcoin’s chart pattern rather than staying inverted.
This is a classic case of my #1 Rule of Technical Analysis, which holds that “A phenomenon will remain in effect only until noticed.” (And if you write about it, it will tend to fail.)
Bitcoin’s price plot was likely skewed by the anticipation of the introduction of Bitcoin futures trading which commenced Dec. 15, 2017. Once futures trading got going as a real part of Bitcoin’s path through the universe, the relationship seems to have returned to being a case of following market forces, and thus the message of what’s ahead for the DJIA went back to working again.
If it keeps on working into the future, then the DJIA is facing a bottom in early April. I think that bottom will actually arrive a bit earlier, as discussed in the latest issue of our twice monthly McClellan Market Report newsletter. But the continued Bitcoin weakness is not good news for the bulls, assuming that the relationship really does hold up.
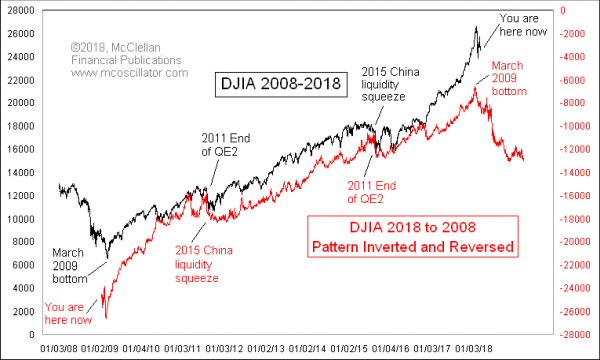
Back on Jan. 18, I wrote about a fun way of seeing the DJIA’s chart pattern in “Ending How It Began (Parabolically)?” I compared it to a musical composition by Beethoven which two violinists could play from the same piece of sheet music, each reading the notes upside down from how the other one saw it.
Here is how that comparison turned out:

As that article hypothesized, the March 2009 bottom seems to have seen its echo in the Jan. 26, 2018 top. The red line in this chart is the same as the black line, just rotated 180°. If the pattern correlation continues to “work”, and that is a big IF, then stock prices have further to fall.
It is fun finding the ways in which the market reveals its intentions about the future. Such insights do not necessarily continue to work as one expect them to, and so they do not deserve our unquestioning confidence. But they sure are fun sometimes.
Tom McClellan
Editor, The McClellan Market Report
