Wolf Richter wolfstreet.com, http://www.amazon.com/author/wolfrichter
“Bloodbath” and similar technical terms crop up in the media.
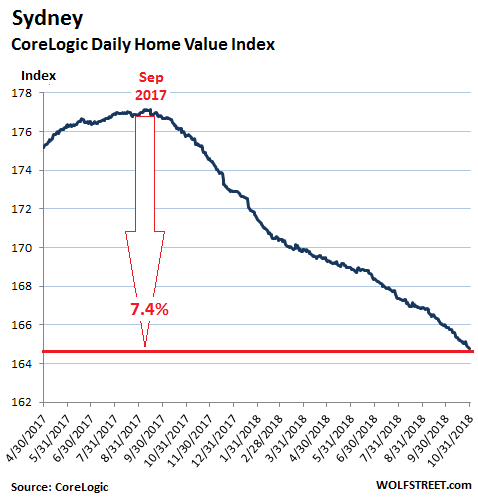
Sales of houses and condos in Greater Sydney, Australia’s largest housing market, plunged 16.7% in October compared to October last year, even as advertised listings surged nearly 20%, to the highest level for this time of the year since 2009, according to CoreLogic. And prices fell in October:
- Prices of single-family houses dropped 8.4% year-over-year
- Prices of condos – “units” in Australian – fell 4.9%;
- Prices of all types of dwellings combined fell 7.4%;
- Prices at the most expensive quarter of the market dropped 8.6%;
- Prices at the least expensive quarter of the market fell 4.6%;
The worst hit regions in Greater Sydney were the suburb of Ryde (-14.4%), Baulkham Hills and Hawkesbury (-10.3%), and Parramatta (-10.3%). CoreLogic’s Daily Home Value Index is now down 7.4% from its peak in September last year:
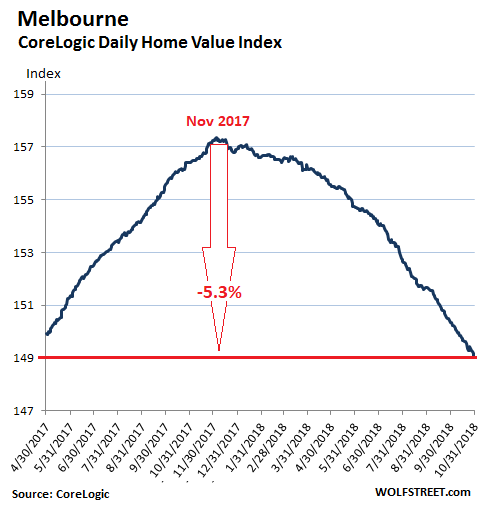
In Melbourne, which has been lagging behind Sydney, a similar scenario is playing out, as sales in October plunged 14.4%, even as advertised listings surged nearly 20%.
- Prices of single-family houses dropped 6.3% year-over-year;
- Prices of “units” fell 1.1%;
- Prices of all types of dwellings combined fell 4.7%,
- Prices at the most expensive quarter of the market dropped 8.9%;
- Prices in Melbourne’s tony Inner East plunged 10.3%;
- But prices at the least expensive quarter of the market, the “more affordable” segment rose 2.9%.
The peak in Melbourne occurred last November, and from this peak, the CoreLogic Daily Home Value Index for all types of dwellings has now dropped 5.3%:
The other capital cities were mixed, with Darwin and Perth in decline since 2014, and Hobart having become the last hotbed of housing speculation. These are the price changes of houses and condos combined in October, compared to a year ago:
- Brisbane, Queensland: +0.3%
- Adelaide, South Australia: +1.8%
- Perth, Western Australia: -3.3% and are down 13.5% from their peak in 2014 following the mining bust.
- Darwin, Northern Territory: -2.9%
- Canberra, Australian Capital Territory: +4.3%
- Hobart, Tasmania: +9.7%
“The weakest conditions continue to be felt across Australia’s two largest cities where investment buyers have been the most concentrated, supply additions have been the highest, and where housing affordability is the most stretched,” CoreLogic notes in its report.
Nationally, sales in October dropped 11% from a year ago. And even in speculative hotbed, Hobart, appetites may be waning. It has been doused in media hype as fortunes were turning in Sydney and Melbourne. But in October, sales in Hobart dropped 11.4%, according to CoreLogic Asia Pacific’s head of research Tim Lawless.
Even as sales dropped across Australia in October, advertised listings rose 10.5% year-over-year.
And CoreLogic’s index for prices of all types of dwellings nationally fell 3.5%, “signaling the weakest macro-housing market conditions since February 2012,” said Tim Lawless in the report.
So how big is the decline relatively speaking, and is this the end of the decline? The report adds:
The downturn in housing market conditions has been relatively mild to date, with the 3.5% fall in dwellings values over the past twelve months coming on the back of a 34% rise in national dwelling values over the growth cycle. With credit availability remaining tight and rising inventory levels, we are expecting there will be further downwards pressure on housing values…
With total listing numbers likely to push higher over the final quarter of the year, buyers are becoming more empowered and will increasingly find themselves in a stronger position when it comes to negotiating on price.
As housing prices have surged over the past years much faster than rent, gross rental yields declined to record lows. But now, the combination of declining prices and rising rents are slowly lifting gross rental yields from their record lows. Nationally rental yields inched up to 3.9% in October, from 3.7% a year ago. CoreLogic:
Rental yields were compressed more significantly in Sydney and Melbourne, reaching record low readings of 3.04% and 3.07% respectively in 2017. These cities are still recording the lowest yield profiles at 3.24% and 3.34% at the end of October 2018.
If financing costs, maintenance, insurance and other costs are included, rental yields are negative. In other words, at these yields, landlords lose money. The only saving grace is “negative gearing,” as it’s called down-under: the tax write-offs against regular income. But this too has come under attack.
After years of media hoopla about the excitement and profits of speculating in the housing market, the media is now peppered with articles about a bitter reality, with the technical term “bloodbath” being cited regularly. For example, frazzled home sellers had to grapple with a story in the Financial Review about a $2.2-million or 28% year-over-year plunge in the “value” of a “large house in a prestigious, leafy Melbourne inner suburb,… highlighting a sharp downturn in the Melbourne market” (amounts in Australian dollars):
The four-bedroom, two-bathroom house on a 1210-square meter block, which is close to some of the state’s most prestigious state and private schools, was passed in on Saturday for $5.6 million, having been sold last November for $7.8 million.
The Financial Review noted that “Melbourne’s weekend auction sales slid to record-year lows and Sydney struggled to clear half the properties for sale in another bleak outcome for one of the most important weekends of the spring sales season.” And then the inevitable “bloodbath” quote:
“It’s a bloodbath,” said Emma Bloom, a buyers’ agent for Morrell and Koren. “There’s a big increase in the number of auctions where there is only one bidder, passed in without a bid, or being sold below expectations.”
This is when media frenzy that for years had added fuel to the speculative fires turns in the opposite direction after prices have started to fall, and as speculators abandon the market. It creates the opposite feedback loop, where the mood of potential buyers sours further as lower prices beget lower prices. Boom and bust.