via Ploutos
- With stocks making new highs to start 2018, the S&P 500 is now trading at all-time highs as a multiple of average hourly earnings.
- Stocks are as expensive as they have ever been for the average American, but does that mean they are overvalued?
- This article discusses some of potential drivers of this expanding multiple.
As the S&P 500 (IVV, SPY) continues to make new highs in early 2018, it is prudent for investors to ask themselves if continuing to pay premium multiples is warranted.
An interesting way to consider the current price level of the S&P 500 is to compare it to average hourly earnings. At Friday’s close, it would take the average worker 129 hours to purchase the index level of 2,873. That is the highest multiple of all-time, exceeding the previous peak of 108 hours when the tech bubble was fully inflated in March 2000.
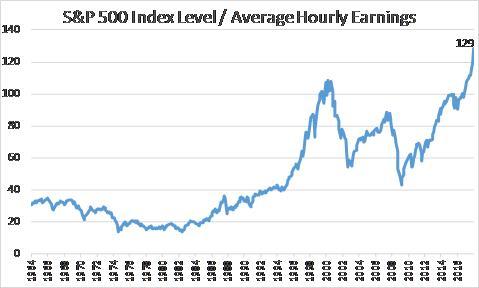
A few words on the data before delving into an interpretation of this chart is warranted. The average hourly earnings figure is from the Bureau of Labor and Statistics and tracks the average hourly earnings of non-supervisory private enterprise workers on non-farm payrolls in nominal dollars. For December 2017, the average hourly wage was $22.30/hour, translating to $44,600 a year for 2,000 hours (50 weeks of 40 hours per week).
This ratio shares much in common with one of Warren Buffett’s favorite valuation metrics – market capitalization to U.S. gross domestic product. After all, one way to calculate GDP is to sum all of the incomes earned in a country’s borders, and the S&P 500 price level is a common proxy for the broad market.
We are now at the highest multiple in over 50 years, but there may be a couple of competing and/or complementary explanations that are driving this historic multiple.
- Tax Policy: Our tax policy has long favored individuals who earn income off of their invested capital over those who earn their income off their labor. Tax-exempt municipal income tends to favor those in the highest marginal tax rates. The 15% tax rate (20% in highest bracket) on qualified dividends and long-term capital gains for 2017 is the same marginal tax rate for a laborer making between $10k and $38k per year. The recent tax reform will have its largest impact on corporate tax rates. Shareholders will earn higher after-tax income. While we have seen some corporations discuss passing these savings through in the form of higher wages, a corporate tax cut boost to run rate earnings and share prices could exert pressure on this multiple of average earnings ratio.
- Income Inequality: In a continuation of some of the themes from the Tax Policy discussion above, income inequality could be a driver of this ratio. Average wages might not accurately capture the demand for equities from wealthy investors. While the average worker consumes much of their income, those at the far end of the income distribution have much higher disposable income to invest in capital markets. Per capita income of roughly $57,000 is meaningfully higher than the annualized wage rate as this number encapsulates the skew from those with higher incomes excluded from this dataset.
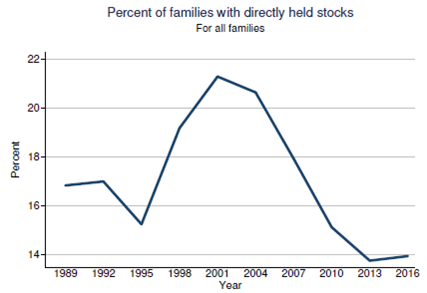
- Wealth Inequality: As I have described in my “5 Ways to Beat the Market Series“, household ownership of stocks has been falling even as stocks have hit new all-time highs. With stock ownership concentrated in the hands of wealthy households, comparisons to average income may be less meaningful.
- Transforming Economy: As the U.S. economy has become more focused on services, this “blue collar” gauge may be less telling. The broader wage datasets from BLS that I found did not have as long of a history, which is obviously important to comparing this multiple across business cycles.
- Tech Boom 2.0: The five companies with the largest market capitalizations in the United States are dominant players in the digital economy. Apple (AAPL), Alphabet (GOOGL) (GOOG), Microsoft (MSFT), Amazon (AMZN), and Facebook (FB) all boast market caps above $550B. These five companies alone make up 13.5% of the S&P 500. These companies’ earnings are much less labor-intensive, which may be a driver of this expanding market valuation multiple. For example, Facebook’s 23,000 employees would barely put the company in the top half of S&P 500 companies. That number of employees is similar to that of Atlanta-based regional bank SunTrust (STI) or trucking company J.B. Hunt (JBHT)
- Other Factors:
- Subdued volatility from extraordinary monetary accommodation globally could be expanding equity multiples relative to income levels.
- Historically low interest rates and subdued pressure on wage inflation could be allowing multiples to rise relative to average earnings.
- Low interest rates and poor retirement savings could also be keeping Baby Boomers in the stock market longer than expected, further boosting equity multiples.
- Improved earnings quality post-Sarbanes Oxley could be allowing investors to pay higher multiples where there had been no previous ambiguity on labor wages.