by Dana Lyons

Historically, the next 2 quarters represent the worst 2-quarter stretch for stocks in the entire Presidential Cycle.
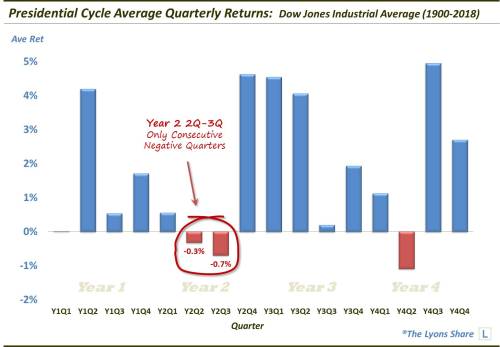
The Presidential Cycle refers to the pattern of behavior in stock prices throughout the four years of a presidential term. While there are many factors influencing stock prices during a particular period of a particular presidential term, it has been one of the more historically consistent seasonal patterns. Specifically, stocks tend to be strong during certain periods of a president’s term and weaker during others. And, historically, the worst 2-quarter stretch of the presidential cycle is the period spanning the 2nd and 3rd quarters of the second year of a president’s term. The stretch began this week.
Over the past 100 years, average returns in the Dow Jones Industrial Average for both the 2nd and 3rd quarters of “year 2’s” have been negative, the only consecutive negative quarters of the entire cycle.

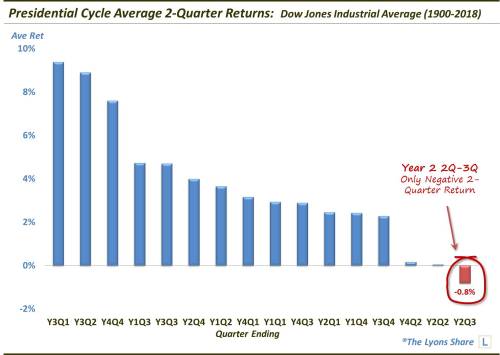
Furthermore, in aggregate, the 2-quarter stretch ending with the 3rd quarter of year 2 of the presidential cycle is the only 2-quarter stretch with a negative average return in the entire cycle.

Of course, seasonality is only one factor affecting stock prices. Therefore, this negative historical tendency should only be treated as a gentle headwind. However, after a lengthy stretch in which bulls seemed to have just about everything going their way, more and more of these potential headwinds seem to be popping up of late.