by howmuch
In November 2019, U.S. debt surpassed $23 trillion for the first time. Due to higher government spending and decreased taxes under the new 2017 tax codes, the budget deficit is also the largest it’s been since 2012. Although the federal government has been spending more than it has been accruing in revenue, that’s not necessarily the case for individual states. To get a better idea of financial wellbeing at the state level, our two new visualizations take a closer look at how each state’s expenditures compare to revenue.

Use this visualization
- In 2017, the total revenues for state governments amounted to $2.55 trillion. Revenue came from taxes, insurance trust revenue, intergovernmental revenue, and other sources.
- The total expenditures for state governments amounted to $2.31 trillion in 2017. These expenditures included intergovernmental spending, current operation expenses, assistance and subsidies, interest on debt, other expenses, and insurance benefits and repayments.
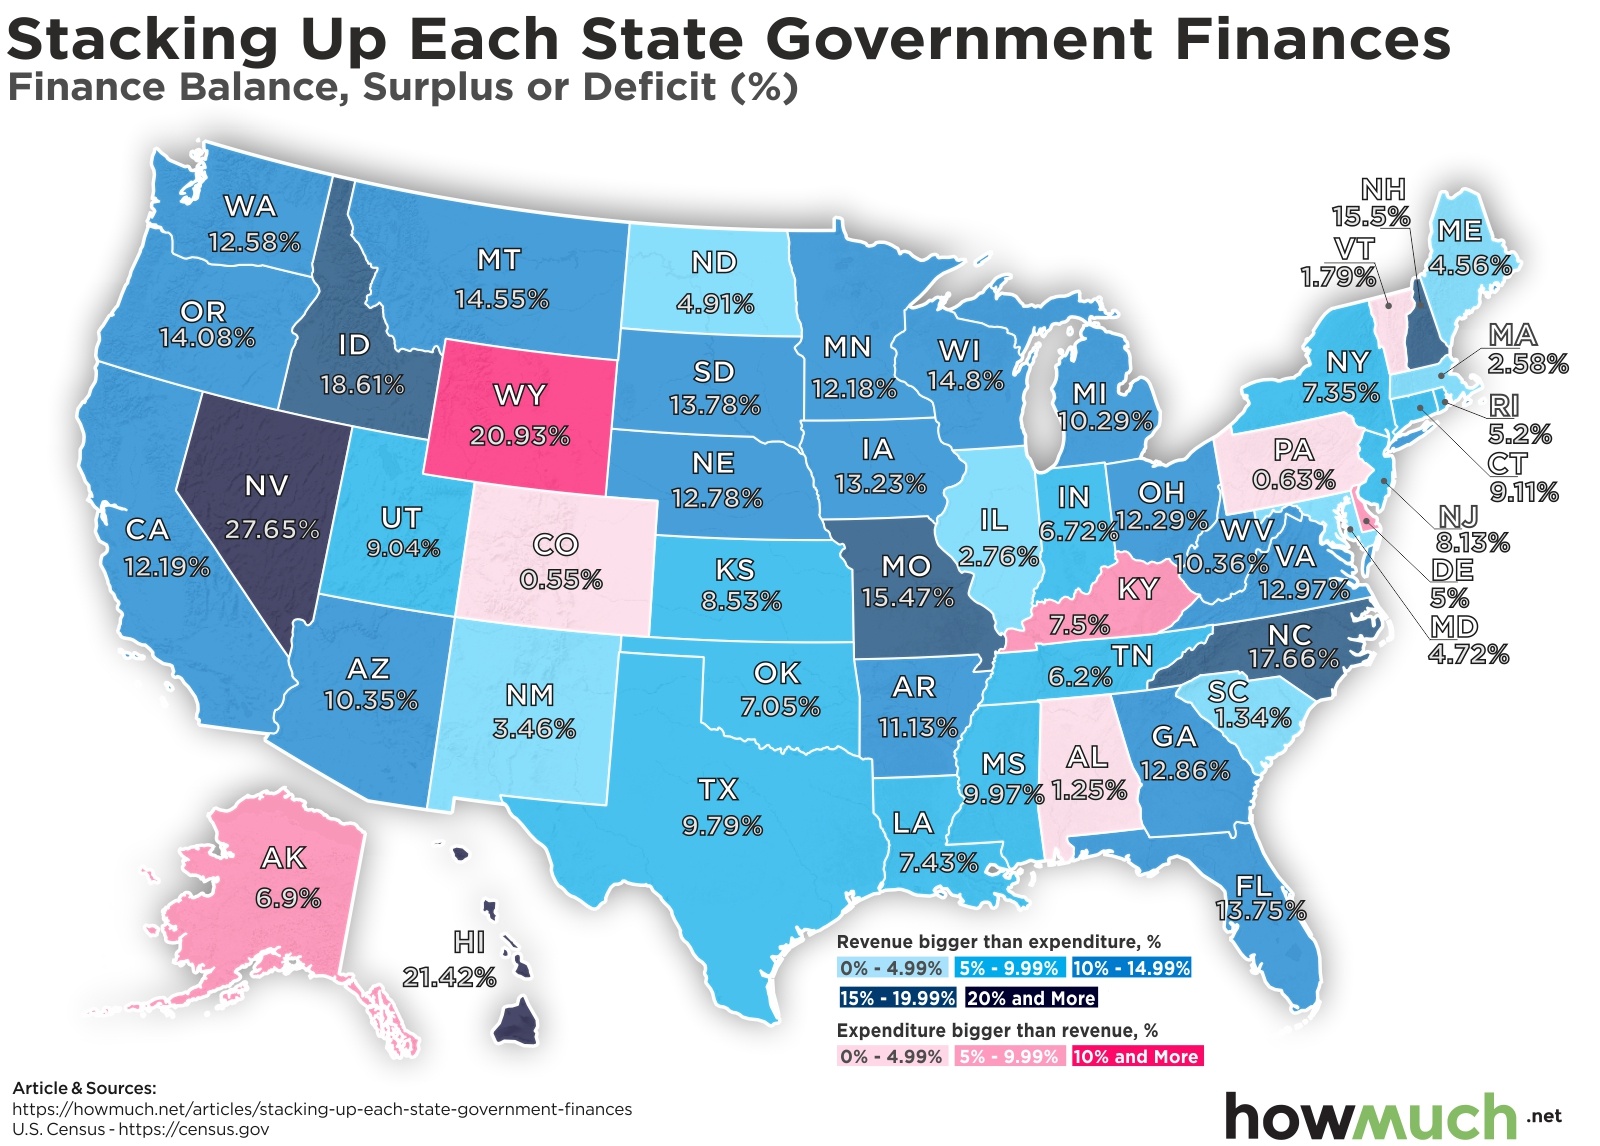
- There are only eight states in which total expenditures exceed total revenues: Wyoming, Kentucky, Alaska, Delaware, Vermont, Alabama, Pennsylvania, and Colorado.
- Nationwide, the revenue per capita is $7,842 and expenditure per capita is $7,120.
- Not surprisingly, states with smaller populations tend to have higher expenditures and revenues per capita. Of the six states with a population under 1 million people, four have expenditures per capita over $10,000 (Alaska, Wyoming, Vermont, Delaware) and four have revenues per capita over $10,000 (Alaska, Wyoming, Vermont, North Dakota).

Use this visualization
Both of these visualizations relied on data from the U.S. Census Bureau’s Annual Survey of State Government Finances. This report collected data from the 50 state governments, excluding local government data and Washington, D.C. This report defines “state government” as the executive, legislative, and judicial branches of a given state, as well as agencies, institutions, commissions, and public authorities under administrative or fiscal control of the state. The state population data used in calculating the per capita expenditures and revenues came from the Census Bureau’s FactFinder database.
The first visualization is a color-coded map of the U.S. to show at a glance how each state’s total expenditures compare to total revenues, resulting in a surplus or deficit. Shades of blue indicate a surplus (with darker blues having a higher percentage of revenues compared to expenditures), while shades of pink indicate a deficit (with darker pinks having a higher percentage of expenditures compared to revenues). The second visualization gives a further breakdown of where these revenues and expenditures come from. The shades of pink represent total expenditures per capita and the shades of blue represent total revenues per capita.
Top 5 States with the Highest Surplus, By Percentage
1. Nevada: 27.65%
2. Hawaii: 21.42%
3. Idaho: 18.61%
4. North Carolina: 17.66%
5. New Hampshire: 15.5%
Top 5 States with the Highest Deficit, By Percentage
1. Wyoming: -20.93%
2. Kentucky: -7.5%
3. Alaska: -6.9%
4. Delaware: -5%
5. Vermont: -1.79%
With November 2020 on the horizon, questions about government debt, tax rates, and the expansion of social programs will be at the forefront of national conversation. For example, Elizabeth Warren has stated that expanding Medicare could be done without putting more pressure on the average American’s pocket. However, other personalities like millionaire Ray Dalio think that government debt and rising healthcare costs will force the government to raise taxes anyway.
In addition to government debt, corporate debt could play a major role in the predicted economic downturn. Despite rising debt in both the government and corporate sector, the U.S. seems to be weathering the storm comfortably, at least when it comes to job creation. However, the consensus is still to prepare for a slowdown, even though a full-blown recession is not expected any time soon.
How do you think state spending and revenue will change in 2020? How will population changes affect the economic health of each state? Let us know in the comments.