Today’s restrictive Fed policies in a rapidly deteriorating economy are the preconditions for a steep recession. Contrary to the unprecedented monetary and fiscal support we had following the last economic downturn, we are currently experiencing a major withdrawal of liquidity at a time when corporate fundamentals are starting to contract. Despite the deepest yield curve inversion in decades, the Fed is raising rates at its fastest pace since 1984 as it prepares to shrink its balance sheet by $90 billion per month, starting next month. Already, in the last three months, M2 money supply also contracted by its largest amount in 63 years!
In the meantime, inflation remains deeply entrenched in the economy. These are arguably the most challenging set of circumstances the Fed has confronted in many decades. Central banks can sacrifice economic growth as long as unemployment rates stay low, which we believe to be highly unlikely.
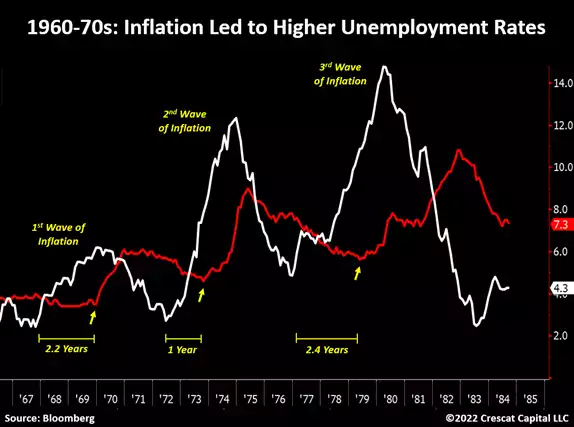
Looking back at the Great Inflation period from the late 1960s to the early 1980s, the rise in consumer prices preceded substantial increases in unemployment rates. On average, after two years of the initial appreciation in inflation rates, labor markets started to falter. Today, it has been exactly two years and three months since CPI rates began to trend higher. With such a level of monetary tightening with already eroding economic conditions, we strongly believe unemployment rates are poised to rise significantly from their current levels.
Inflationary Recession
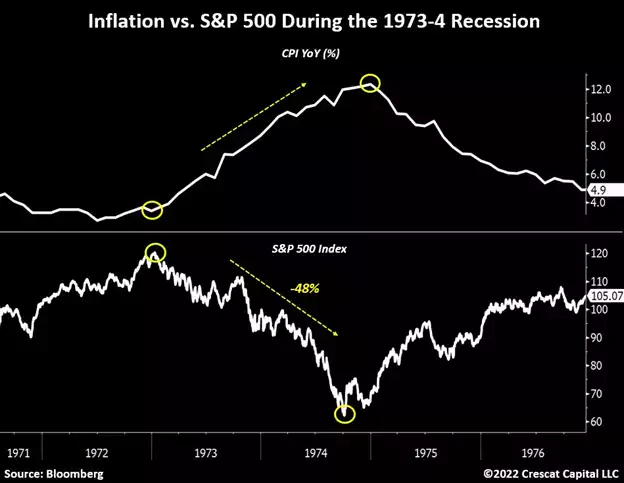
In 1973-4, it took a decline of 48% in stocks for inflation to start trending lower for the next couple of years. The persistent increase in consumer prices at the time forced the Fed which had to radically tighten financial conditions. As a result, a brutal inflationary recession followed and, outside of precious metals, overall equities and Treasuries collapsed together. A similar macro setup is unfolding today.
In our view, the US and most other developed economies have decisively entered an inflationary regime. Consequently, the role of monetary policy will be much more directed towards price stability which inhibits the backdrop of excessive central bank liquidity that drove overall market prices to today’s unsustainable levels.
We believe January 3rd marked the peak for US stocks and this is just the beginning of a bear market from truly historical overvaluations.
Opportunities Abound
Decades of reckless Fed actions have created one of the most frenzied investment environments in stock market history. Outside of natural resource industries, we are seeing a profusion of unsustainably high valuations across most of the equity market.
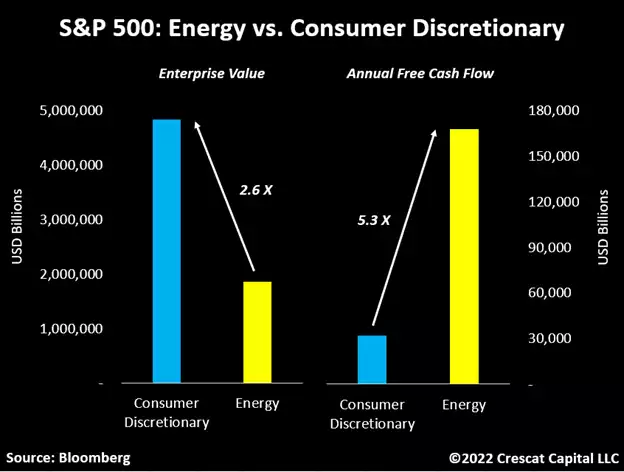
Unsurprisingly, today’s consumer discretionary sector is now worth 2.6 times the size of the energy sector, while the latter generates over 5 times more in free cash flow. We believe these price imbalances are true opportunities. In our global macro and long/short hedge funds, we are long undervalued stocks in scarce commodity industries today, including precious and base metal miners, oil and gas E&Ps, and fertilizer producers while we are short a variety of overvalued stocks in a variety of sectors with deliberate over-weighting of short positions in consumer discretionary and information technology, in particular mega-cap tech.
The Fundamental Setup for Mining Stocks
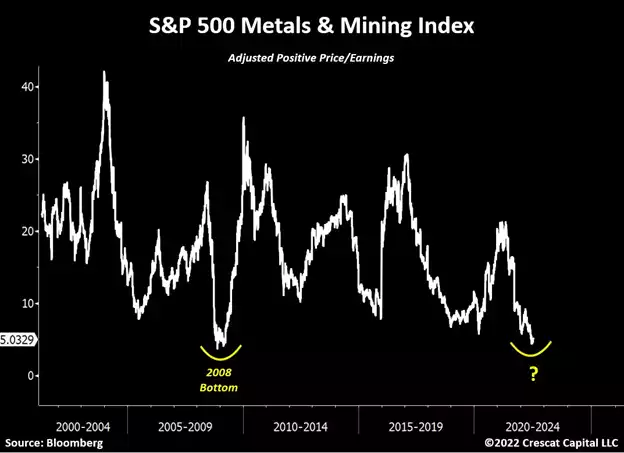
In a similar concept to how historically undervalued energy companies continue to be, other commodity businesses may offer an even stronger value proposition. Mining stocks, for instance, are currently trading at multiples not seen since their historically most depressed levels. This is a function of falling stock prices coupled with strong fundamentals. The P/E ratio for metals and mining stocks in the S&P 500 are now retesting the lows of the 2008 bottom.
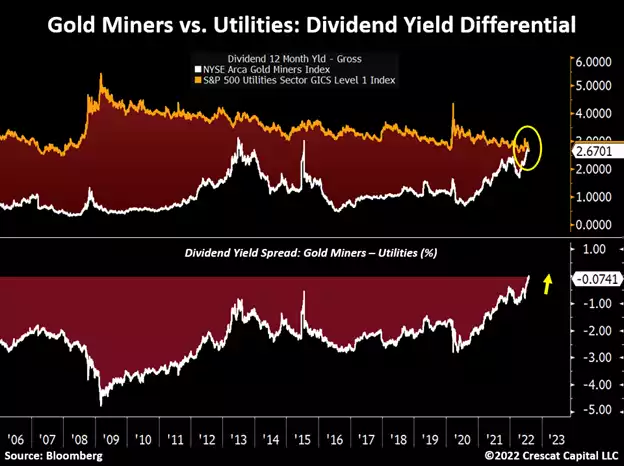
Greatest Dividend Yield in Almost a Decade
Gold miners also have the highest dividend yield in almost ten years. While this seems compelling, it is just a supplementary part of our bullish thesis on gold and silver mining stocks. These companies are almost paying more dividends than utility stocks for the first time in the history of the data.
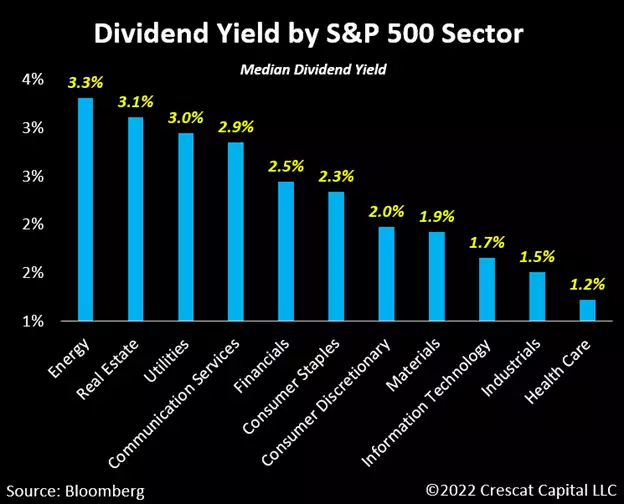
Similarly, energy stocks are paying more dividends than any other sector in the S&P 500 today.
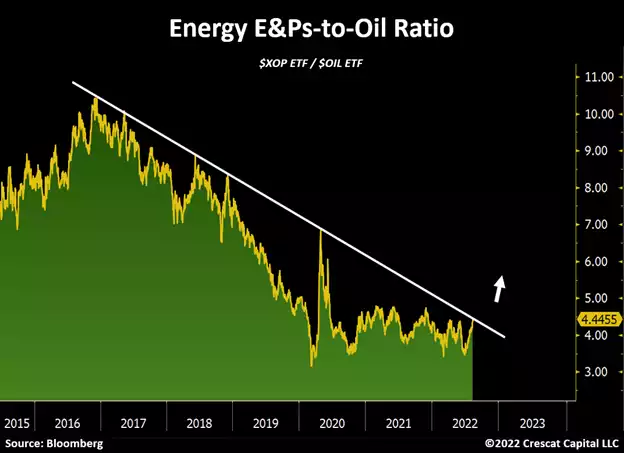
Energy Stocks-to-Oil Ratio on the Rise
Energy stocks have underperformed oil prices for almost six years. Even after most energy commodities reached a bottom in April 2020, exploration and production companies have not kept up with the level of appreciation. It is interesting, however, that in this recent pullback in WTI and Brent oil prices, energy stocks behaved significantly better. We think this is a very bullish sign for the overall industry. It is always important to see the risker parts of a sector leading the way. We believe the energy stocks-to-oil ratio will break out from this key resistance and continue to move higher.
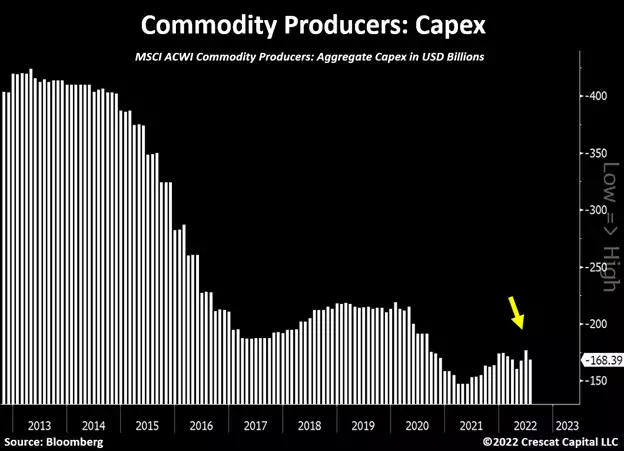
The Resurgence of the Inflation Narrative
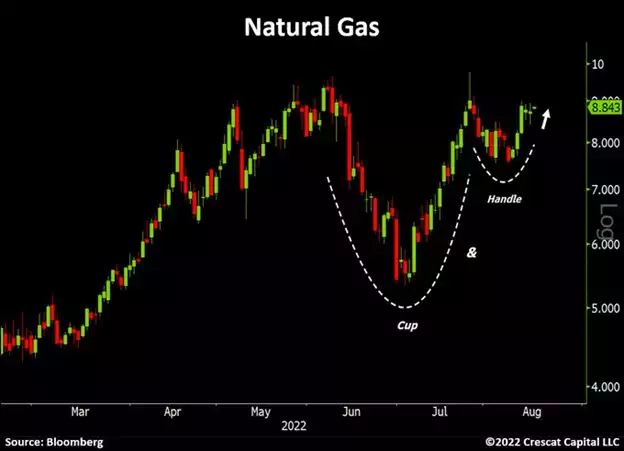
None of the structural issues causing inflation have been resolved. Overall CAPEX for commodity producers has gone nowhere and monetary tightening has only reduced capital available for new investments. We believe that the Fed still runs a major risk of prematurely shifting its hawkish stance and re-igniting the inflation narrative. The softer tone we have seen from policy makers recently is likely to drive commodity prices higher again. That has already begun. Look no further than natural gas prices making new highs recently.
Natural Gas Sends Strong Message
The surge in natural gas prices to recent highs is perhaps one of the most important developments unfolding in the macro environment today. It is happening right at a time when the inflation narrative has dissipated due to recession fears. The appreciation of natural gas reminds us that commodity markets are fundamentally linked. Rising energy prices often drive rising agricultural and materials prices.
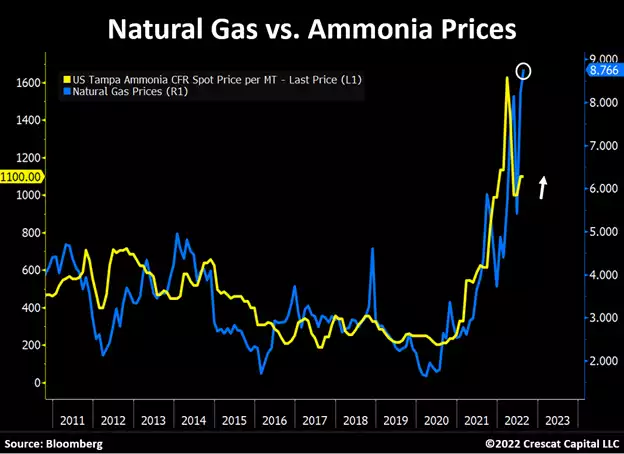
Natural Gas and Ammonia Prices Are Strongly Correlated
Note the historical correlation between natural gas and ammonia prices. In the past, one has led the other. Higher ammonia prices mean higher fertilizer prices which trigger agricultural commodities to rise leading to higher food prices.
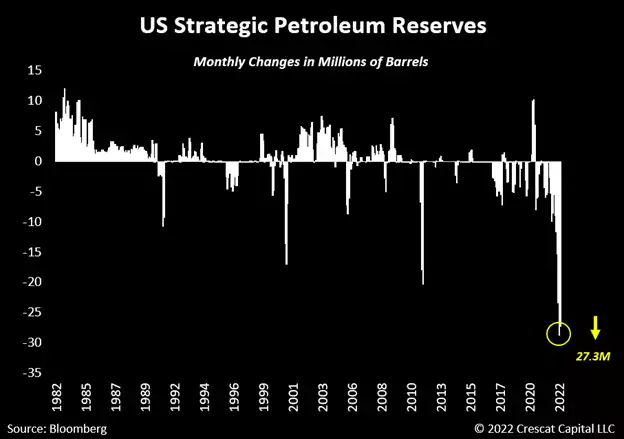
Most Erratic Energy Policy in History
In case one thinks that the selling pressure in oil has been solely driven by recession fears, the US government just sold another 27 million barrels last month. At this pace, the strategic petroleum reserves (SPR) will be zero in 18 months.
Nonetheless, with recent recession fears, the demand deterioration in the Chinese economy, and the US government selling its SPRs, one would think oil would not be trading anywhere close to as high as $90 per barrel. Such strength in the price speaks to the overall supply tightness in the energy market. We believe oil is headed substantially higher.
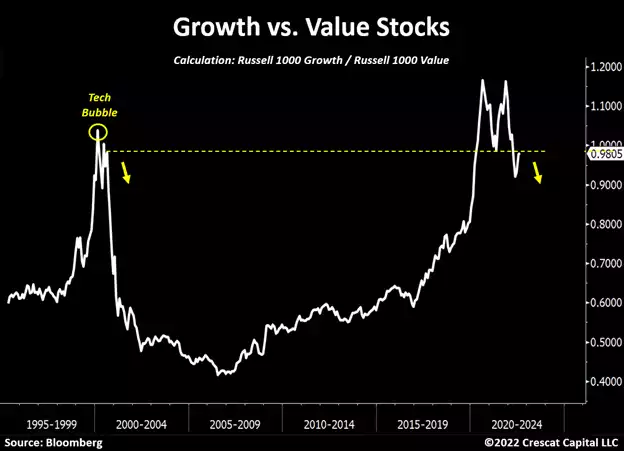
The Early Innings of a Bear Market
Equity markets are not priced for the vicious stagflationary environment that we envision. Overall, stocks are behaving as if we were still in a secular disinflationary environment which allows the Fed to loosen monetary conditions without causing inflationary pressure. As prices for goods and services continue to increase at historically elevated levels, so will the cost of capital. That is not a positive scenario for growth stocks, particularly relative to value companies. The Russell Growth vs. Value index spread still is near the peak levels reached in the Tech Bubble of 2000. This further supports our view that the decline in the overall equity markets is just the beginning.
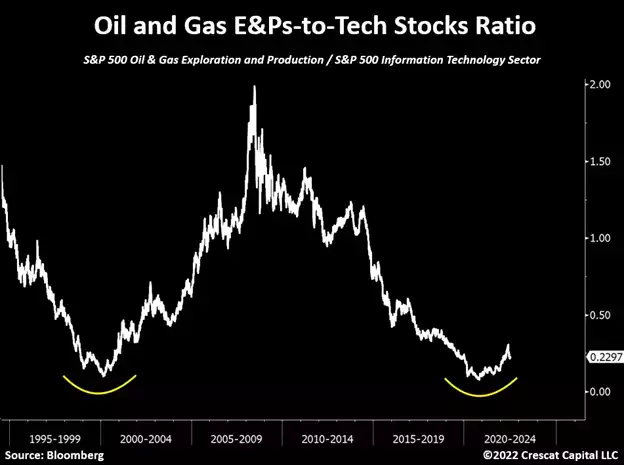
Value vs. Growth
The long-term double bottom in the energy-to-tech stocks ratio illustrates how early we are in this upward trend for oil and gas stocks. For over a decade, capital flows have solely focused on growth-related companies and have completely forgotten about businesses that are crucial to the basic functioning of the global economy. We are excited to be able to invest in historically undervalued energy companies at what we believe to be only the beginning of an inflationary era.
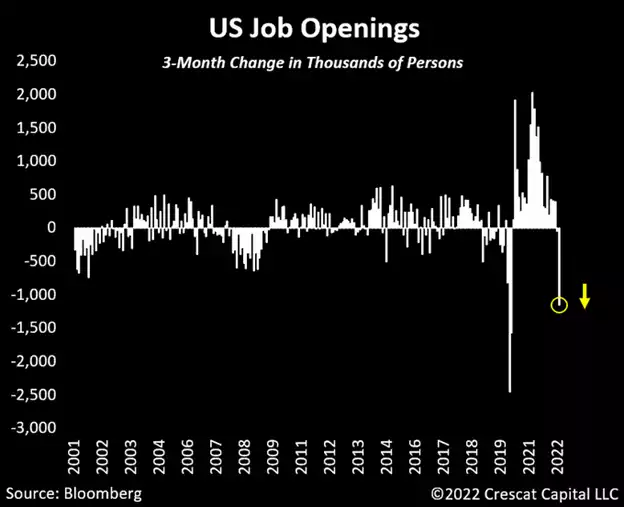
Job Openings Collapsing
Maybe it is just a coincidence, but 774 CEOs have left their roles this year in the US alone. That is the highest number in 20 years!
What do these high-profile executives know that investors don’t?
There have been significant changes in labor market indicators recently. Job opening just had their largest 3-month decline in the history of the data, excluding the initial shock of the pandemic. This is probably just the beginning. Fed tightening with PMIs already at levels only seen in the Global Financial Crisis is just one more nail in the coffin for the economy.
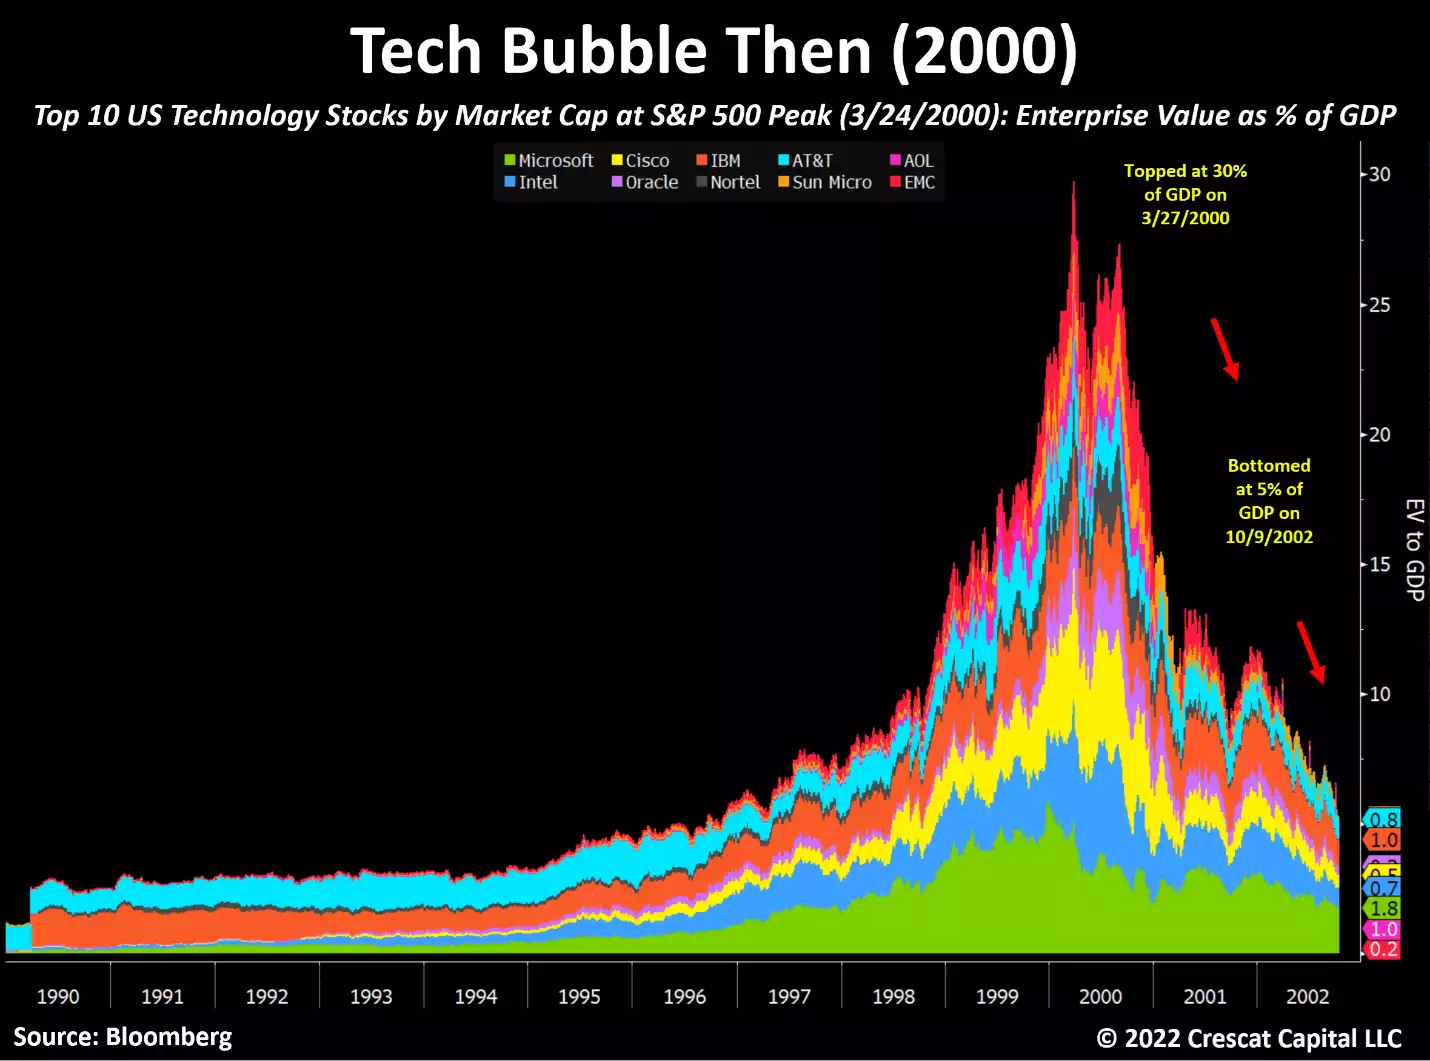
Tech Bubble on Steroids
At the height of the Tech Bubble in 2000, the top-10 US market cap tech stocks collectively reached an enterprise value of 30% of GDP. The problem then was the same as it is today. Growth expectations were too high for these companies. Their valuations had simply become too rich relative to the size of the overall economy to justify the growth assumptions.
Furthermore, the spending boom to address the Y2K computer problem made the fundamentals truly unsustainable. Investors were extrapolating high short-term growth rather than realizing that it was a top in both growth and profitability for the business cycle. Over the next two and a half years, the enterprise value of these companies would plunge to just 5% of GDP as the combined revenue, earnings, free cash flow, and stock prices for these companies plummeted and led the entire economy into recession.
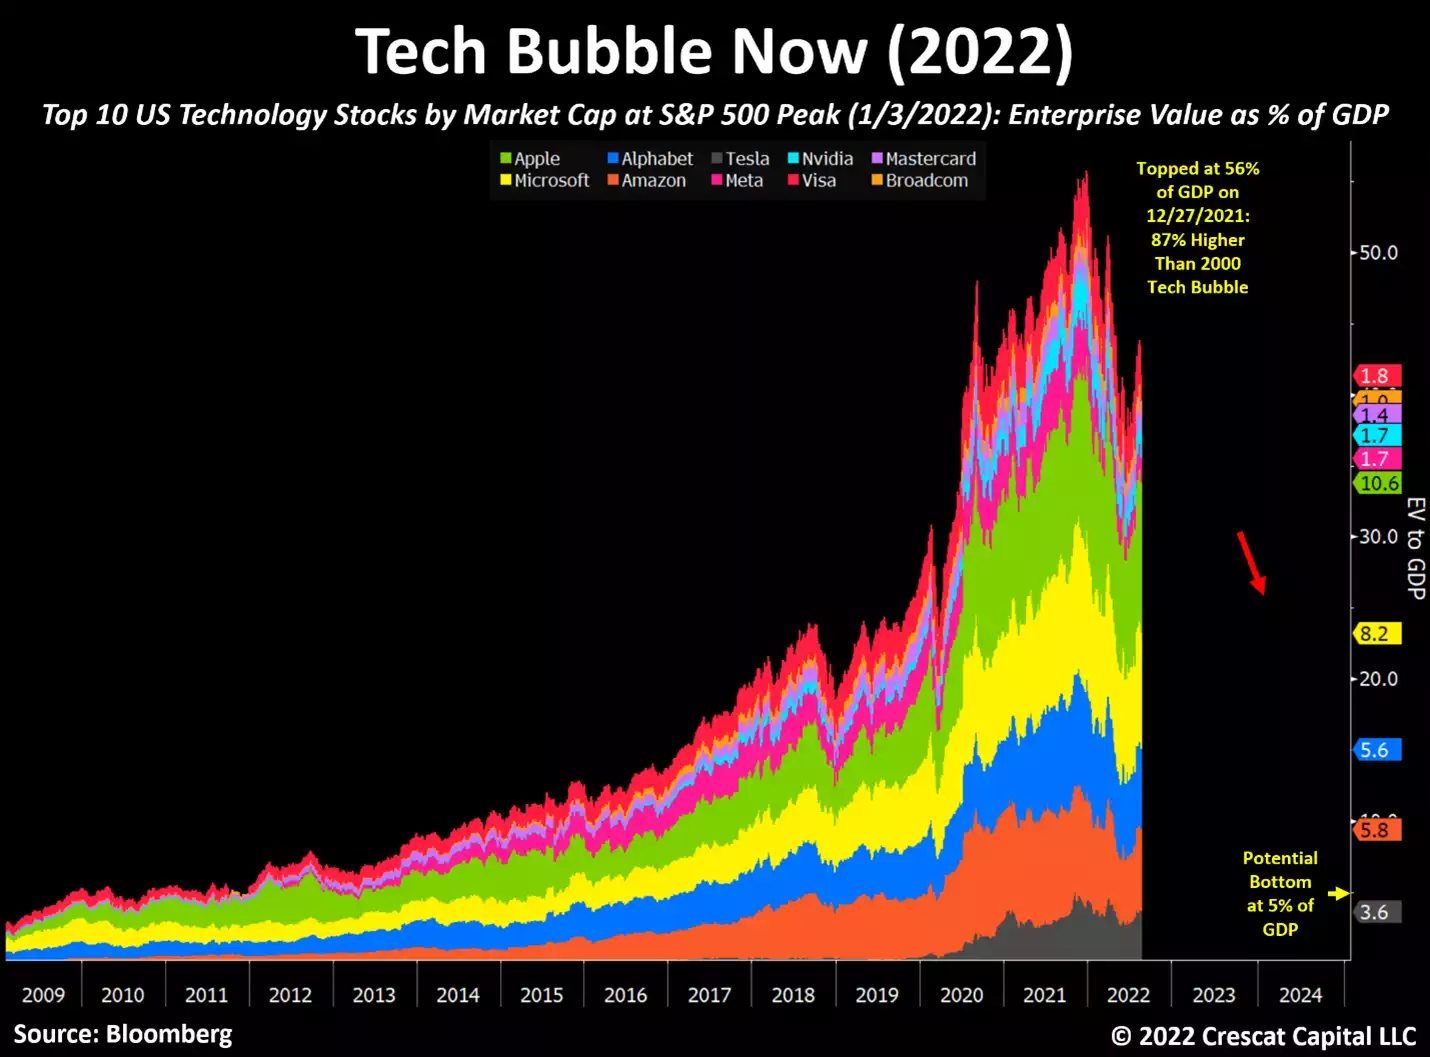
Fast forward to year-end 2021, the height of today’s mega-cap-tech-led stock market bubble. The top-10 US market cap tech stocks collectively reached an even higher 56% EV to GDP, 87% higher than it was at the peak of the 2000 tech bubble. The record-breaking fiscal and monetary stimulus during Covid accelerated the move to the cloud and the corresponding IT spending boom, just like Y2K. Once again, investors have extrapolated unsustainable growth and profitability to justify high valuations.
Remarkably, even as the fundamentals are already deteriorating, the further downside risk for these mega-caps remains totally incomprehensible to most market participants today. The common investment narrative remains that these companies have reasonable P/E ratios. Not only is the E coming off unsustainably inflated levels, but the P/E multiple is also too high compared to likely future growth.
The chart below shows the potential further downside risk for the top-10 mega-cap tech stocks today, on an EV-to-GDP basis, if they were to approach the same cyclical low valuation levels that they did in 2002 of 5 times EV to GDP. We are not necessarily calling for a full retest of those multiples, but we believe the market will continue to head in that direction. We are indeed looking for substantially lower stock prices for many of these companies along with continued downward revisions to earnings and free cash flow projections and contracting multiples, all of which should coincide with an economic recession over the next several quarters.
Investors have been buying the dip and continue to get sucked into what we believe has been a mere bear market rally over the last two months, one that is starting to roll over again. The technical analysis of this macro/fundamental chart looks like a monster head-and-shoulders pattern.
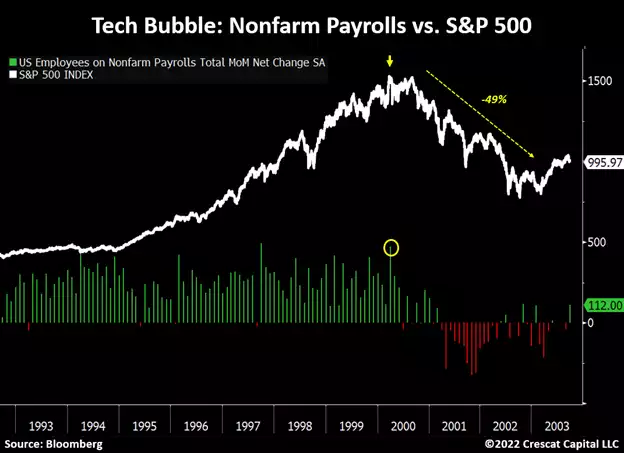
Payrolls: Still Partying Like It’s 1999
Nonfarm payrolls recently surprised the markets with a surge of 528,000. Despite what seems to be very positive news, here is a reminder that nonfarm payrolls also surged by almost 500,000 right at the peak of the tech bubble in March 2000. It is important to understand that most labor market gauges are lagging indicators. An extremely low unemployment rate is often a contrarian indicator.
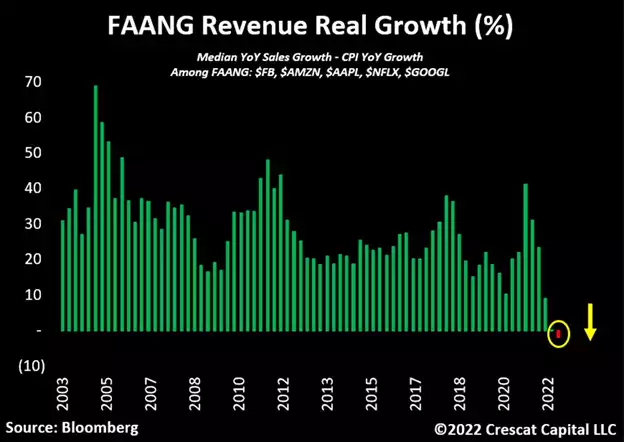
Hardly Even Growth Stocks Anymore
In contrast to what most investors believe, the “FAANG” stocks are starting to show serious signs of weakness in their fundamentals. The median real revenue growth for these companies has officially turned negative for the first time in almost two decades. Interestingly, investors still consider them “growth” stocks despite their meaningful exposure to a cyclical downturn in the economy at large. We think mega-cap tech companies pose a significant risk to the overall equity market. After years of attracting investment flows from capital markets on the back of incredibly successful business models, these stocks are deteriorating fundamentally, and most investors are not even paying attention.
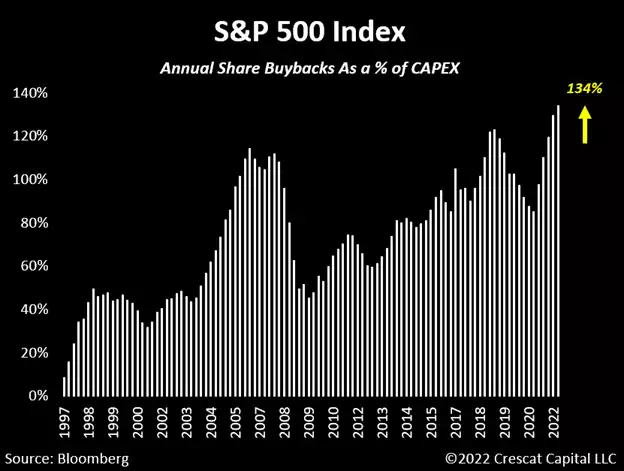
More Buybacks Than Capex
S&P 500 companies are spending more money on share buybacks than they are investing in their businesses. They are doing this at the highest ratio in the history of the data which goes back 25 years. Aggregate annual buybacks are 134% of CAPEX. This trend is likely to crimp productivity growth and innovation for years to come.
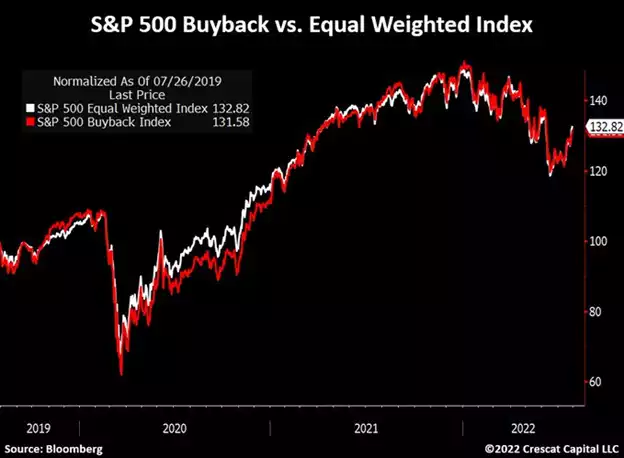
Financial Engineering Failure
While many investors believe share buyback programs have been widely successful, the data shows otherwise. Stocks with the highest buyback ratios have underperformed the overall market in the last three years. It gets worse. If we look at the members of the S&P 500 Buyback index, 89% of their cash flow generated in the last 12 months was used to buy back their shares. Managers have been making poor capital allocation decisions, buying back expensive shares, and under-investing in future growth.
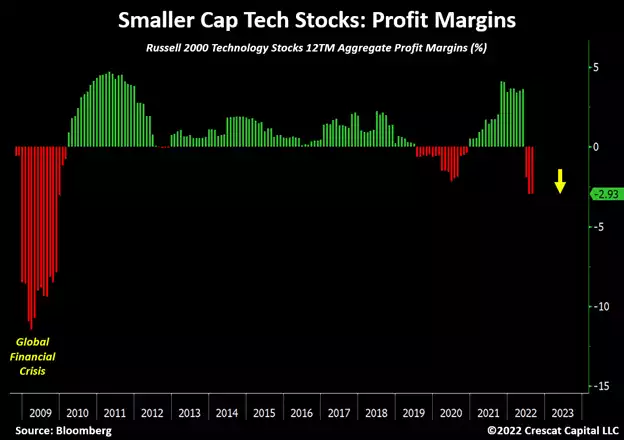
Contracting Fundamentals
While we have seen most stocks in the technology sector being re-rated at lower price levels, fundamentals for these businesses continue to weaken, particularly for the smaller players. Aggregate profit margins for the Russell 2000 Technology index members are now at their lowest level since the Global Financial Crisis.
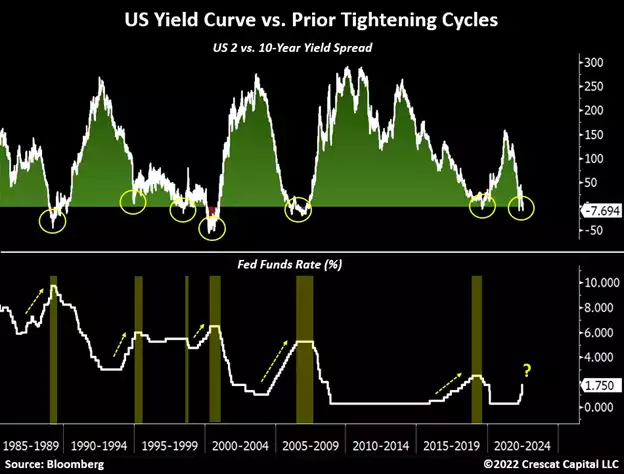
Yield Curve Inversions During Tightening Cycles
In the last 30+ years, every time the yield curve inverted, the Fed was forced to end its tightening cycle as the economy was heading into a recession. Over time, the sharp reversal of these policies, i.e., subsequent easing cycles, are what have fueled the excesses we see in financial asset valuations today.
For every economic downturn we have had since the late 1980s, government and Fed support became progressively larger. Such policy behavior is only achievable in a macroeconomic environment where inflation is not a long-term problem.
In the inflationary late 1960s to early 1980s, in contrast, central banks were much more limited in their ability to deploy liquidity measures during recessions. We think we are entering a similar macro setting today. This potential lack of liquidity is yet to be reflected in the prices of risky assets, which remain near historic high levels. Nonetheless, despite the steep inversion in the US yield curve, we think the Fed will be forced to remain hawkish for longer. In our strong view, the tightening of financial conditions in a fragile economy should be detrimental to equity markets.
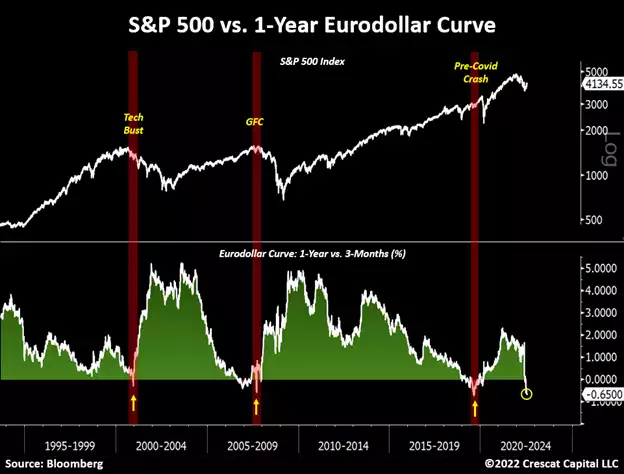
Unsustainable Inversion
The 1-year Eurodollar curve is now as inverted as it was at the beginning of the Global Financial Crisis. That just means markets believe the Fed will be forced to cut interest rates in the next 12 months. For us, this inversion reflects how investors continue to bet on the potential for a deflationary outcome.
We believe it is unlikely that the Fed will be able to loosen financial conditions given that long-term inflation expectations are likely to remain well above the 2% target. In this sense, today’s setup reminds us of the 1970s when policy makers will be forced to maintain a hawkish stance for longer. As a result, market liquidity will remain challenged.
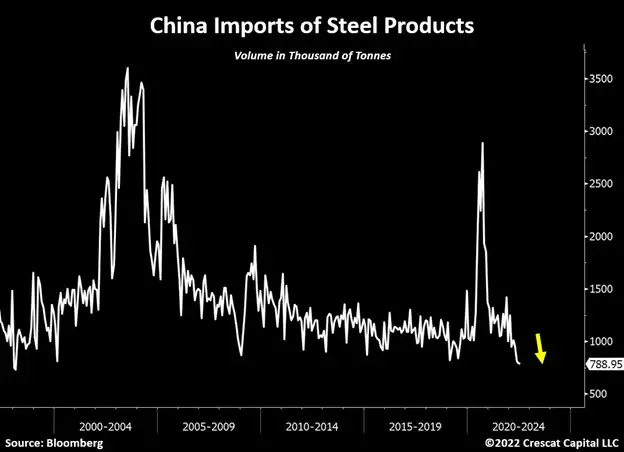
China’s Balance Sheet Recession
China is currently facing a full-blown balance sheet recession due to an over-levered banking system and real estate market. The unwinding of its severe macro imbalances has forced the PBOC to loosen monetary conditions not only in an inflationary environment but also with a significantly more restrictive Fed policy. In our strong view, a devaluation of the Chinese yuan is the next wrecking ball that very few investors are positioned for.
Note how China’s imports of steel products are now at the lowest level in 24 years.
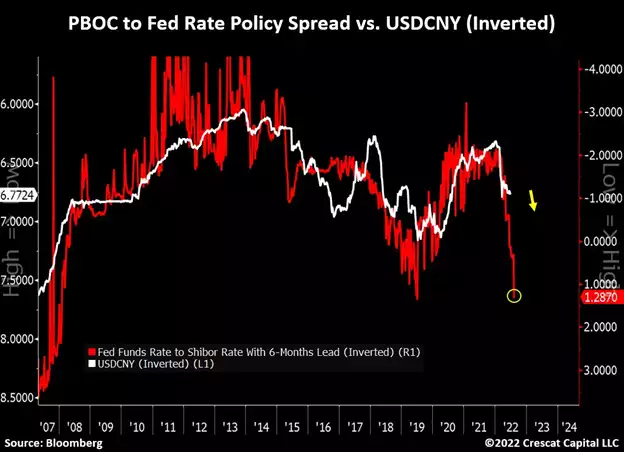
The Fed is Tightening While the PBOC is Easing
The PBOC-to-Fed’s interest rate policy spread has consistently led the changes in USDCNY by 6 months. Such divergence in central banks’ stance is likely to add major pressure on the yuan to depreciate relative to the dollar.
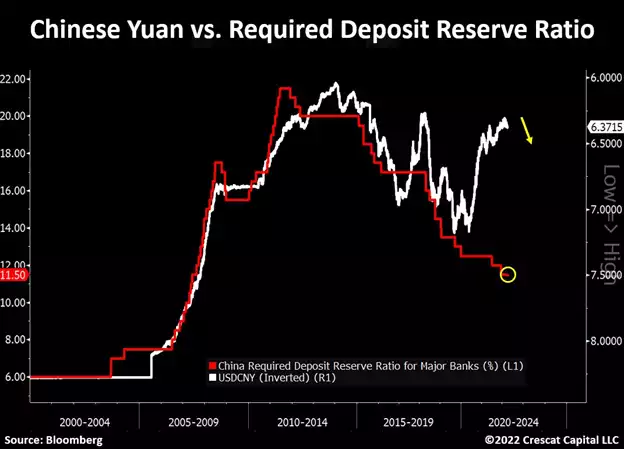
The disconnect between the Chinese yuan and the required deposit reserve ratio for major banks remains one of the most important charts in the current macro environment.
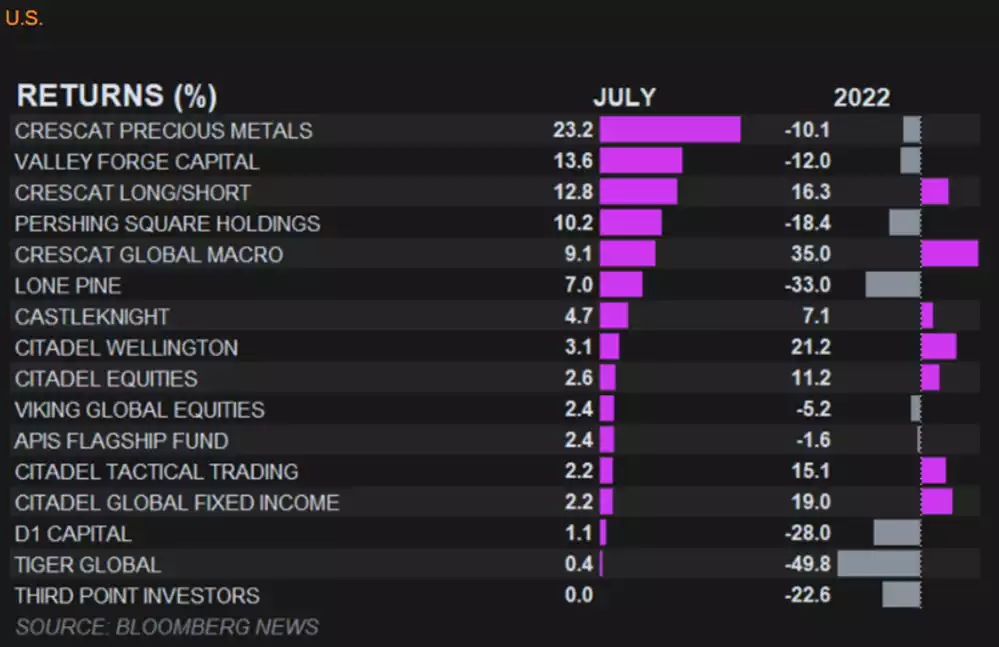
Bloomberg Brief
Every Tuesday, Bloomberg releases a table featuring select hedge funds. The list focuses on the top-performing funds for the previous month based on Bloomberg’s database and reporting. The table also shows year-to-date returns for those funds. For July, Crescat had three of the top-five performing funds with the Precious Metals Fund taking the #1 spot. Among the July winners, Crescat’s Global Macro Fund and Long Short Fund had the #1 and #3 best year-to-date returns. We are honored to be showcased in Bloomberg’s table among some of the best-known hedge funds in the industry.
Net Performance Through July 2022
We are pleased to report that all Crescat strategies were in the black in July with performance being driven primarily by strength on the long natural resource equity side of our portfolios.
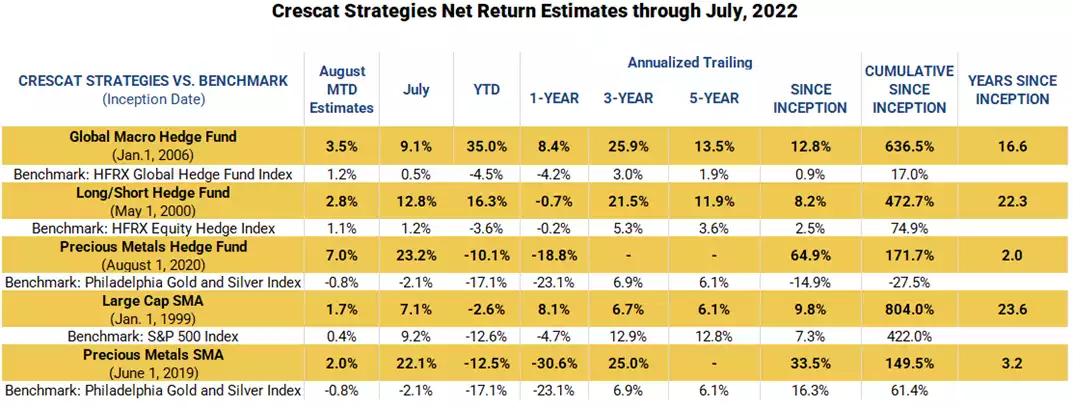
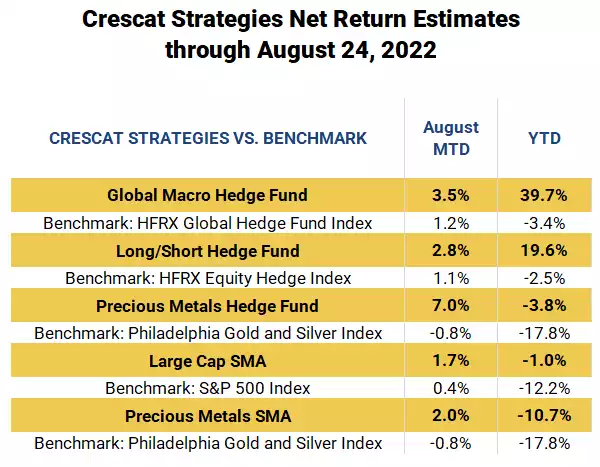
August MTD Estimates
These trends have continued in August while short-related themes in Global Macro and Long/Short have performed well over the last week.
Consider Whether Crescat Strategies Might be Right for You
We are very appreciative of our long-standing and new investors in our strategies. All of us are extremely grateful to that who have been adding money recently to our funds to help us take advantage of the extraordinary opportunities that we see in the market today. We are focused on deep value high appreciation potential long positions across all strategies. We are determined to capitalize on both structural resource shortages and new metals discoveries today while also helping investors hedge against a likely new secularly high inflationary environment. Our Crescat Precious Metals Fund is particularly focused on these opportunities within the mining industry.
We also focused on overvalued short opportunities in the financial markets at large in our Global Macro and Long/Short Funds that are timely given the recent mere bear market rally in the broad equity markets that in our view now appears to be fading. Our analysis supports that we are in a likely-to-be viscous and enduring stagflationary environment that we have only just entered.
We have laid out our investment thesis in our research above and recent letters which we encourage you to read carefully to understand our portfolio positioning. There are still six days left to make a subscription with a September 1st effective date in our hedge funds. If you have been on the fence, let’s set up a call to discuss. We would love to share with you how Crescat can add value to your overall portfolio mix.
Sincerely,
Kevin C. Smith, CFA
Member & Chief Investment Officer
Tavi Costa
Member & Portfolio Manager