I always enjoy reading John Stepek’s work at MoneyWeek. Just recently he addressed the question of where are we in the current market cycle. To wit:
“In his latest memo to clients, [Howard Marks] outlines his basic philosophy and how it affects Oaktree’s investment process at the moment. Marks’ basic point – which appears pretty self-evident, though you’d be surprised by how many people try to deny it – is that markets move in cycles.
The tricky part is trying to work out when the cycle is going to turn.”
This is a fascinating point as it is not just individuals who try and deny that markets, and the economy, move in cycles but also the Federal Reserve and Government agencies. As I noted last week, the Congressional Budget Office is currently estimating the next 10-years of growth in the economy at a steady 2%.
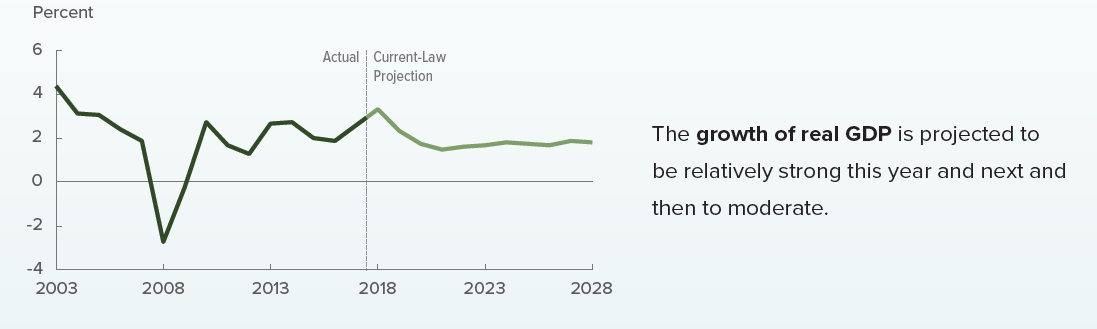
Given this is already approaching the longest economic growth cycle in history, at the lowest rate of growth, and with the Federal Reserve hiking rates, it is highly unlikely the economy will remain “recession free” for another decade. It is also important to note the CBO didn’t predict the recessions in 2001-2002 or in 2008. In fact, in 2000 the CBO predicted the U.S. would be running a $1 Trillion surplus by 2010. They were only off by $2 Trillion when 2010 finally rolled around.
What is clear is that both markets and the economy do not only cycle, but cycle together.
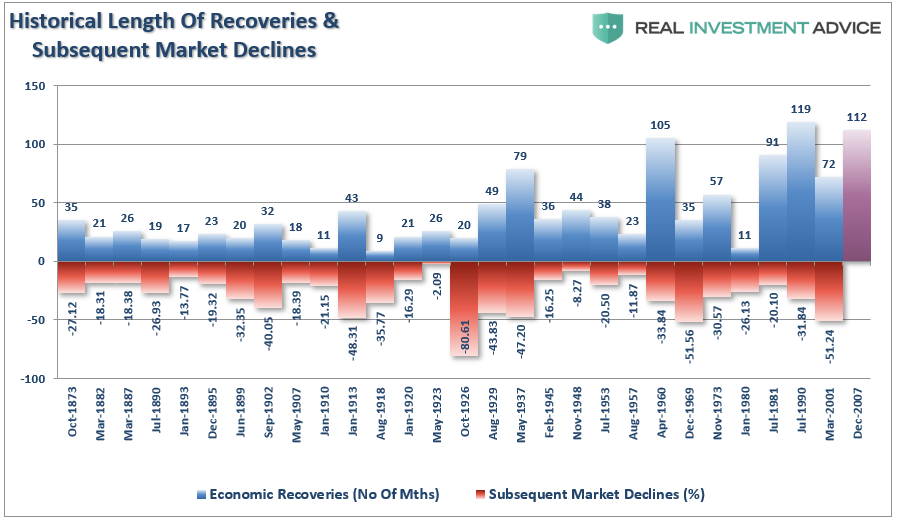
However, knowing when these cycles will occur isn’t that simple. As John notes:
“Of course, it’s not that simple. You might know that winter is coming; you’ll also know when it’s here. But can that knowledge tell you when the first snow will fall – or if it will fall at all?
And there’s your problem right there. Markets might be cyclical but timing them is almost impossible. You might know that the equivalent of an asset-market winter is coming. But you don’t know when it will hit and you don’t know how severe it will be.
So – to put it bluntly – what is the use of a theory of market cycles if it can’t tell you when to invest and when to pull out?”
That is absolutely correct. But it also the same analysis given for valuations.
Just like market and economic cycles, valuations are a horrible “timing” indicator. But like cycles, valuations are simply an indication of expected returns in the future.
As Marks noted there is no magic formula, or timing device, that can tell you “go to cash now” or “go all in today”. However, it is quite obvious that when valuations are elevated, and interest rates are rising, taking on excessive portfolio risk will have a very low future return.
The same goes for market and economic cycles. Today, there are plenty of warning signs which suggest we are nearer the top of this particular cycle versus than not.
As I noted previously:
“Timing, as they say, is everything.
It is worth noting that valuations clearly run in cycles over time. The current evolution of valuations has been extended longer than previous cycles due to 30-years of falling interest rates, massive increases in debt and leverage, unprecedented amounts of artificial stimulus, and government spending.”

No matter how you look at the markets currently, there are substantial signs of excess:
- Corporate leverage is at all time highs
- Margin debt is a record levels
- Investor allocations to equities are pushing record levels
- Investor allocations to cash are at record lows
- Investor confidence is at record levels
- Economic confidence is at record levels
- Rates are rising
- Jobless claims are at record lows
- Stock valuations are at the second highest level in history
Marks also cited several points as well:
- Private equity funds are raising record amounts of money to invest
- A record proportion of loans are now classed as “covenant-lite” (ie, few if any protections for the lenders)
- The quality of debt is deteriorating, and;
- Investors are paying ever-higher multiples for increasingly-indebted companies.
All of these signs suggest an economy, and a market, that is fully matured with investors are behaving imprudently. In other words, things are as “good as they can get,” which happens at the end of a cycle rather than the beginning.
So, How Long Until This Cycle Ends?
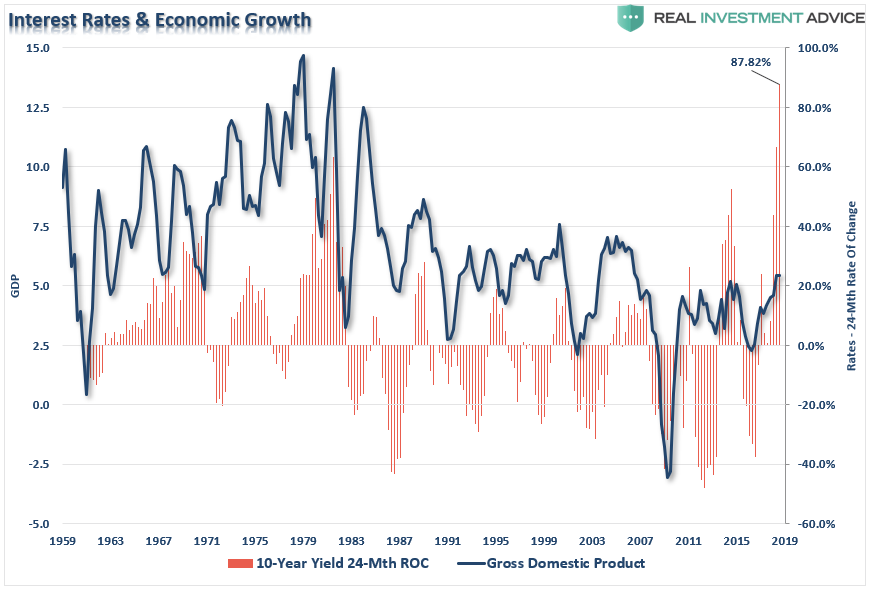
Throughout history, interest rates are at the heart of every cyclical recovery and decline. As I discussed in “Did Something Just Break?”:
“With housing and auto sales already a casualty of higher rates, it won’t be long before it filters through the rest of the economy. The chart below shows nominal GDP versus the 24-month rate of change (ROC) of the 10-year Treasury yield. Not surprisingly, since 1959, every single spike in rates killed the economic growth narrative.”
I urge you not to fall prey to the “This Time Is Different” thought process.
Despite the consensus belief that global growth is gathering steam, there is mounting evidence of financial strain rising throughout the financial ecosystem. The recent spurt of economic growth has been a direct result of massive fiscal stimulus which will fade, wage growth has been weak, and job growth remains below the rate of working-age population growth.
While the talking points of the economy being as “strong as an ox” is certainly “media friendly,” the yield curve, as shown below, is telling a different story. While the spread between 2-year and 10-year Treasury rates has not fallen into negative territory as of yet, they are certainly headed in that direction.

Of course, the yield curve has been a strong predictor of the end of economic and market cycles. As such can it provide us with a clue as to when this cycle is likely to end? As Jesse Colombo recently noted in Forbes:
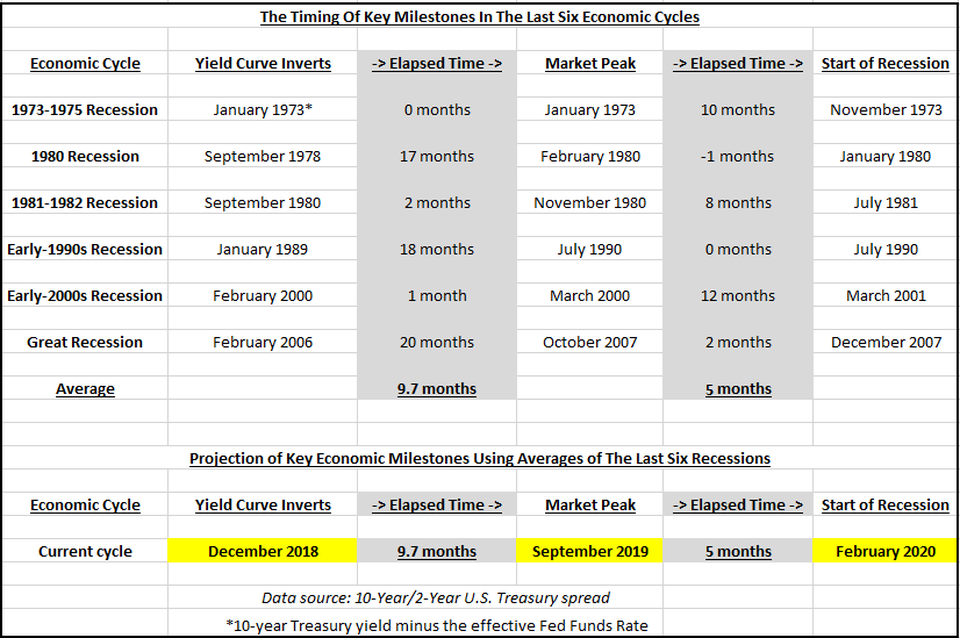
“At the current rate the yield curve is flattening, many economists estimate that the yield curve may invert as soon as December 2018, so we will use that time frame for this exercise. It took an average of 9.7 months between the time that the yield curve inverted and the stock market peaked, which means that the current bull market would peak in September 2019. It also took an average of 5 months between historic market peaks and the start of recessions, which means that the next U.S. recession would start in February 2020, assuming the current cycle follows the historic average perfectly.”
Jesse’s analysis fits with the expectations of two-thirds of economists predictions on the timing of the next recession:
“Two-thirds of business economists in the U.S. expect a recession to begin by the end of 2020, while a plurality of respondents say trade policy is the greatest risk to the expansion, according to a new survey.
About 10 percent see the next contraction starting in 2019, 56 percent say 2020 and 33 percent said 2021 or later, according to the Aug. 28-Sept. 17 poll of 51 forecasters issued by the National Association for Business Economics on Monday.
Forty-one percent said the biggest downside risk was trade policy, followed by 18 percent of respondents citing higher interest rates and the same share saying it would be a substantial stock-market decline or volatility.”
See, nothing to worry about for another 12-months.
Not so fast.
A Funny Thing Happened On The Way To The Recession
The majority of the analysis of economic data is short-term focused with prognostications based on single data points. For example, let’s take a look at the data below of real economic growth rates:
- January 1980: 1.43%
- July 1981: 4.39%
- July 1990: 1.73%
- March 2001: 2.30%
- December 2007: 1.87%
Each of the dates above shows the growth rate of the economy immediately prior to the onset of a recession.
You will remember that during the entirety of 2007, the majority of the media, analyst, and economic community were proclaiming continued economic growth into the foreseeable future as there was “no sign of recession.”
I myself was rather brutally chastised in December of 2007 when I wrote that:
“We are now either in, or about to be in, the worst recession since the ‘Great Depression.’”
Of course, a full year later, after the annual data revisions had been released by the Bureau of Economic Analysis was the recession officially revealed. Unfortunately, by then it was far too late to matter.
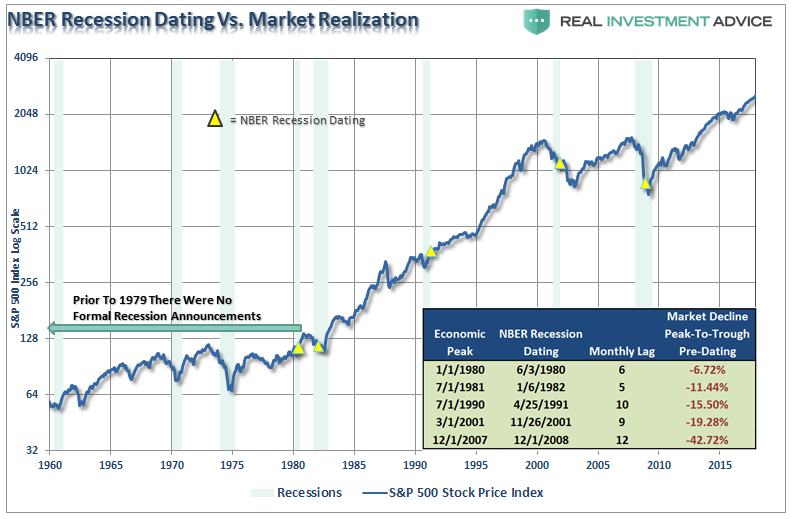
The chart below shows the S&P 500 index with recessions and when the National Bureau of Economic Research dated the start of the recession.
There are three lessons that should be learned from this:
- The economic “number” reported today will not be the same when it is revised in the future.
- The trend and deviation of the data are far more important than the number itself.
- “Record” highs and lows are records for a reason as they denote historical turning points in the data.
Here is the important point.
When will this cycle end? No one really knows for sure.
Will it end? Absolutely.
The recent spike in rates, combined with rising oil prices, is a toxic brew for a heavily indebted consumer both domestically and globally. The recent rise in rates has already accelerated the timing of the next recession and it is now only a function of time until “something breaks.”
As Mr. Stepek concludes:
“Be defensive when everyone else is being aggressive.
Why? So that when the time comes when there are lots of opportunities but hardly any money around (and it will come, because markets are cyclical and winter eventually arrives again), you’ll be in a position to take advantage.
And keep an eye on corporate debt. That’s where we’ll see the strains first.”
While the call of a “recession” may seem far-fetched based on today’s economic data points, no one was calling for a recession in early 2000, or 2007, either. By the time the data is adjusted, and the eventual recession is revealed, it won’t matter as the damage will have already been done.
But then again, “no one could have seen it coming.” Right?