Wolf Richter wolfstreet.com, http://www.amazon.com/author/wolfrichter
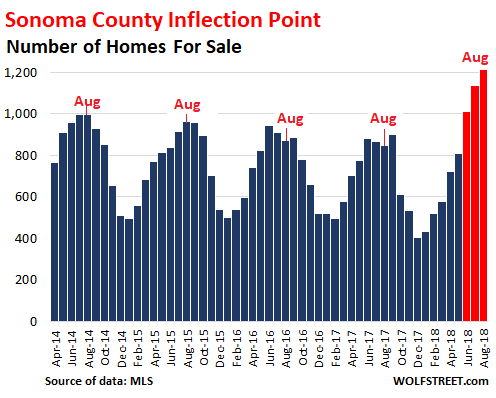
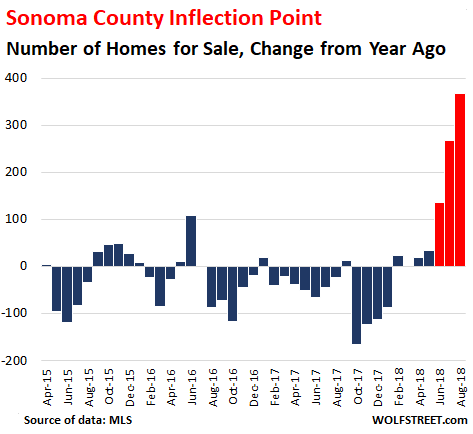
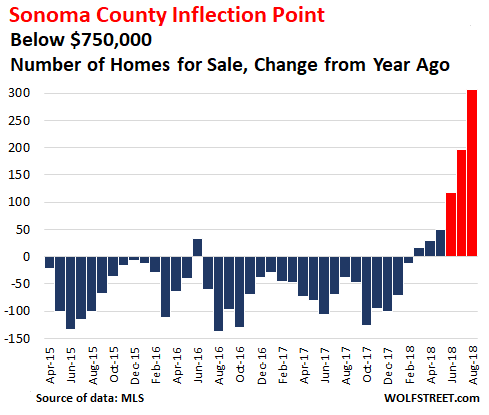
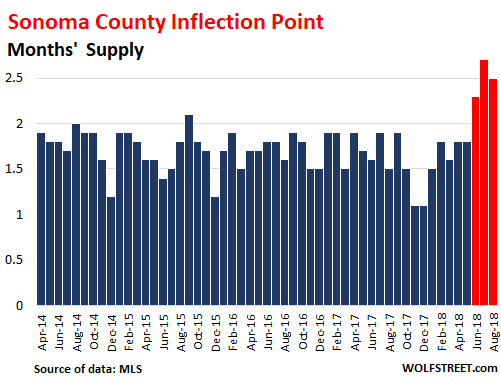
Red indicates the moves since the inflection point in June.
“Having a legal cannabis grower near your property has a significant negative effect on value due to the odors,” explained Thomas Stone, a real estate broker in Sonoma County, California. “This is the first legal harvest in the County, and while better than having a pig farm next door, an acre of flowering cannabis can be pretty overwhelming. You don’t want to show those properties on a warm afternoon.”
Just another wrinkle in the shifting landscape of the housing market in Sonoma County, an expensive San Francisco Bay Area market between the Pacific and Napa County – wine country interspersed with beautiful cities and towns.
A month ago, Thomas Stone and I stuck our necks out and said that the inflection point in the housing market in the county had appeared in June. Housing markets deteriorate beneath the epidermis first, before the deterioration becomes visible in median prices. So here is an update of our anatomy of this housing market, based on August data.
In June and July 2018, supply of homes listed for sale in the county had suddenly jumped to the highest level in years. And in August, supply rose further to 1,216 homes (red indicates the moves since the inflection point in June):
“Inventory continues to grow at a time of year when it usually slows,” Stone said.
This surge in inventories – a first sign of the inflection point – becomes even more obvious when compared to the same month a year earlier. In prior years, supply tightened, with inventories on a downward trend year-over-year. But over the past three months, that has drastically changed. In August, there were 367 more homes listed for sale, up 43% from a year ago (red indicates the moves since the inflection point in June):
Most of the surge in supply happened at the bread-and-butter end of this market, with homes that are listed below $750,000, which covers 66% of the homes sold. And here, the supply surged by 84% (by 306 homes) year-over-year (red indicates the moves since the inflection point in June):
But even as supply surged, total home sales dropped 17% in August, compared to August last year, to 483 homes, the slowest August in the data going back through 2014.
Months’ supply of all homes for sale – the number of homes for sale divided by the number of homes that actually sold – has been mostly between 1.5 months and 1.8 months. But since June, it jumped. In August, it was 2.5 months (red indicates the moves since the inflection point in June):
In the bread-and-butter tier of homes listed below $750K, the surge in months’ supply was even more striking, having jumped from a tight supply between 0.6 months and 1.3 months in recent years to 2.1 months, about double the prior midpoint (red indicates the moves since the inflection point in June):
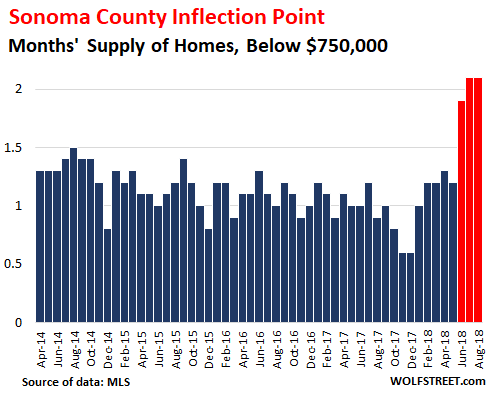
In the mid-tier of prices ($750,000 to $1.3 million), supply reached 3 months. And at the top tier (above $1.3 million), supply jumped to 7.9 months. But in both these lofty price tiers, months’ supply had been higher during the slow months in the winter a few years ago. In the bread-and-butter tier, however, months’ supply shot past all recent high points.
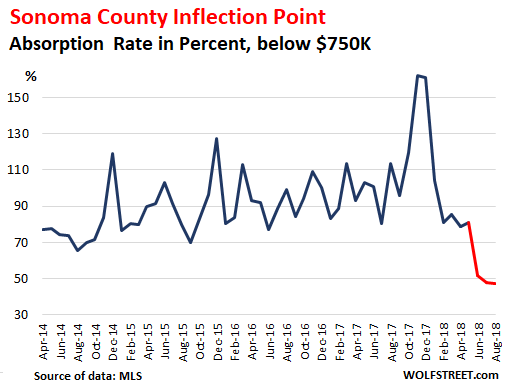
When there is no sale, brokers don’t get paid. When sellers are asking for more money than buyers are willing to pay, sales volume falls off – until sellers start lowering their prices. It is the brokers’ job to convey a sense of reality to their clients – the sellers – to make deals happen. It’s not an easy job, after years of surging prices, which sellers are now taking for granted.
The chart below shows the “Absorption Rate” (the number of sales divided by the number of homes for sale) for homes below $750,000. It shows the percentage of the supply that has been “absorbed” by buyers. The spike in the absorption rate late last year, including in November to 162%, was largely due to the fires – the most destructive on record in California. At the time, buyers grabbed every home for sale. By February absorption had dropped back to 81% and continued to drop. In August, it was down to 47.2%, the lowest in years (red indicates the moves since the inflection point in June):
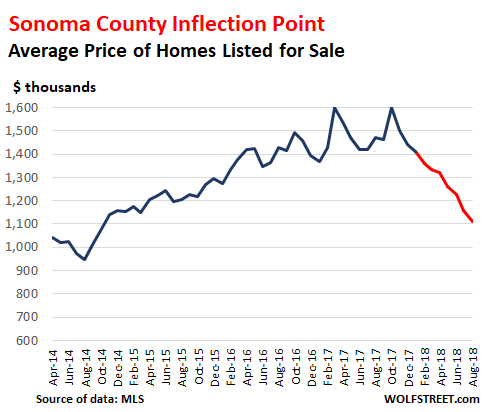
Average price of all homes listed for sale dropped to $1.11 million in August, the lowest since October 2014, down 25% from a year ago. This “average active price” (sum of all asking prices divided by the number of all homes for sale) can be skewed by a small number of very pricy homes. And it is a lot higher than the “median” price of homes that actually sold (more in a moment). Nevertheless, this is a big and consistent move (red indicates the moves since the inflection point in June) :
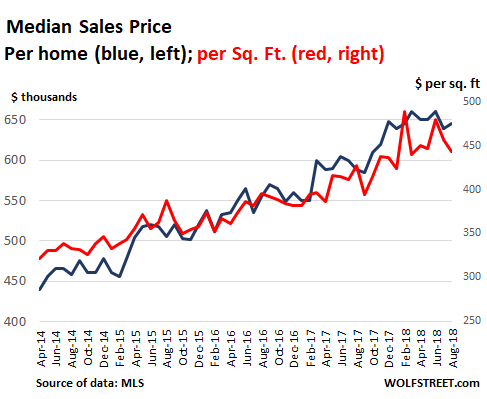
This and similar metrics are visible beneath the epidermis of the housing market. On the surface are the prices at which homes actually sold. The “median sold price” – which means 50% of the homes sold for more, and 50% sold for less – in August, at $645,000, was the second lowest for the year. But it was still up 9.6% from August last year. A slightly different measure, the median selling price per square foot dropped to $443, up 3.7% year over year:

Prices in the county had surged in late 2017, largely due to the fires. This impacts the year-over-year comparisons at the moment. But in 2018, the weakness in prices is becoming apparent, with August prices being at the low end of the range so far this year, as sellers and buyers are trying to figure out how to make the next step in this dance:
“Prices are dropping slowly,” said Stone, who has to deal with this phenomenon every day. The median price is one of the last metrics to change direction because there is a lot of resistance from sellers who are not yet in a rush to sell. Yet the median price, and other price measures such as the Case-Shiller index, which lags even further behind, are our primary housing market indicators outside the profession.