Authored by Sven Henrich via NorthmanTrader.com,
Lots of chatter about a coming melt-up coming in stocks. And why not?
If fundamentals or earnings growth no longer matter and markets are drowning again in artificial central bank liquidity may as well forego any valuation or fundamental discussion.
Yet as we speak markets are getting to key historical levels of technical resistance and points of confluence just as they are getting heavily overbought while the nature of the rally to new highs is extremely poorly constructed.
Let’s take note of some data and charts and ascertain the melt-up scenario as well as reasons as to why this either may not be the case or end in a valley of tears.
Firstly, note the Fed has managed to turn markets into a graveyard. Void of any pulse, void of any intra-day price discovery. Ever since the introduction of ‘not QE’ the character of markets has changed:
The Fed can call it whatever it wants.
But fact is the market's behavior has radically changed since the implementation of "not" QE.
Tight intra-day ranges with virtually no movement.
Price action entirely driven by gaps, ramps & camps like the old QE days. pic.twitter.com/i7cgkN46lX— Sven Henrich (@NorthmanTrader) November 5, 2019
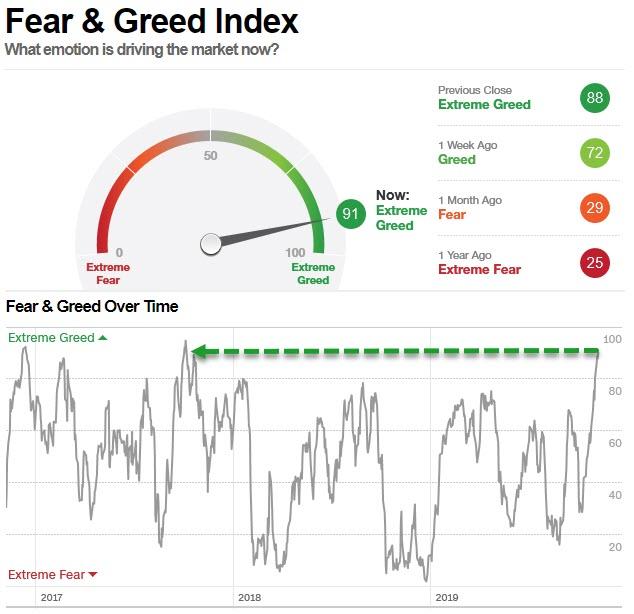
The one way nature of the price action, driven largely by overnight gaps and void of intra-day price discovery, has resulted in many indicators getting to extreme conditions as also evidenced by the CNN Fear & Greed index:
In the Fed’s desperation to control rates the TINA effect is back and money again appears to have little choice but to allocate back into equities. When yields collapsed this summer pension funds were forced to allocate to record levels into stocks. 47% allocation of assets into risk assets, the highest since 2007. Risk assets are again viewed as risk free.
The constant distortions now accentuated by the need to ‘calm’ money markets have brought us back to the old QE days. The Fed is either in denial or outright lying about the impacts of their actions.
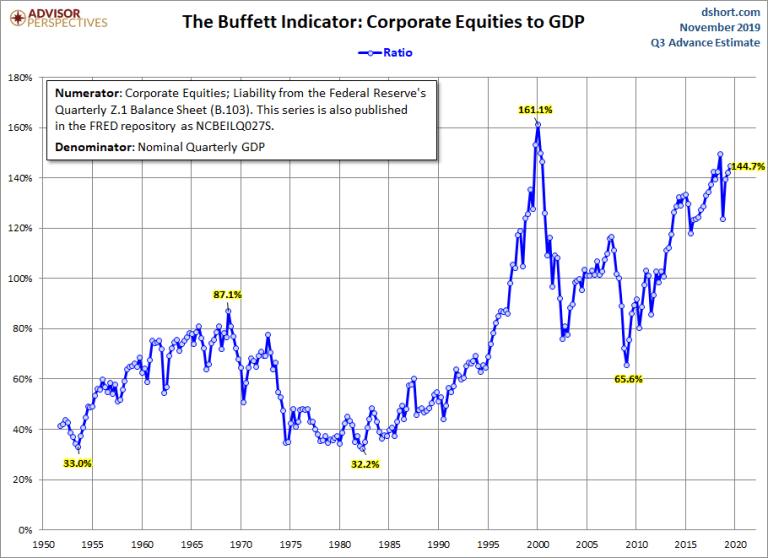
This week markets hit 145.8% market cap to GDP and may even move higher. The great distortion of everything.
In my view all this ultimately will fail. It may make sense to apply such policies at the brink of crisis but not at 145% market cap to GDP. What does this accomplish, but kick the can? Every new high in stock markets is a celebration in more wealth inequality.
Populist anger, largely driven by said wealth inequality, is tearing democracies apart. The US election next year will be as ugly as we’ve ever seen it. Populations are driven apart by ever widening perceptions of realities. It’s all bubbling under the surface.
And yes, without ever admitting to it, the Fed and cohorts are afraid. Afraid that the construct will blow up in their faces. And I can’t blame them, it’s daunting.
But the Fed will fail. Why? Because they never saw it coming. To react this massively only 10 months after they projected a completely different reality (rate hikes and autopilot QT) they are now doing the opposite with guns blazing. There is no grand plan or control, they are reacting, chasing the fundamentals requiring ever more debt expansion to produce ever less incremental growth.
Hope is for another 2016 repeat. And what was 2016 but $5.5 trillion in central bank intervention?
Fact is the natural interest rate market wants to go somewhere else. Without the Fed’s interventions overnight rates would be much higher radically changing everything. It is for this reason we see these daily repos.
While markets are calm on the surface the larger market forces are gnawing at the construct.
And so their only solution is to blow the bubble even larger.
Price drive sentiment. Always does, and now that markets are at all time highs people are getting bullish again. Not because of earnings, or growth or anything fundamentally related. Because price is higher and why is price higher? Because of the Fed, simple as that.
When will we know that all this fails? When there is not a marked turnaround in growth as a result of these actions.
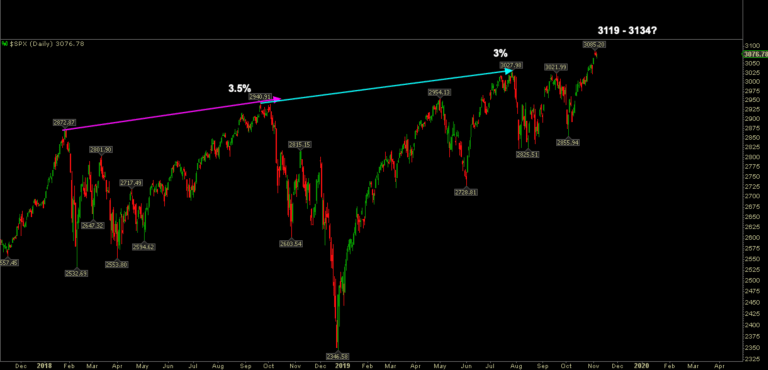
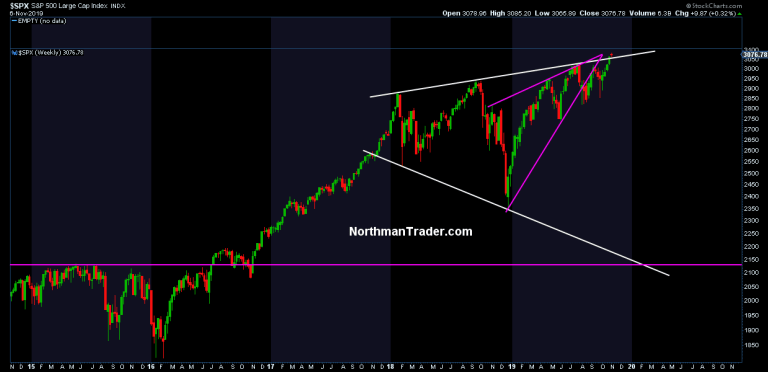
It remains a question of efficacy. For now the efficacy has proven to again produce marginal new highs. And yes 2-3% are marginal new highs. And as we saw last year and this year, marginal new highs of 3%-3.5% were sold off. With a similar run we could even see 3119-3134 on $SPX:
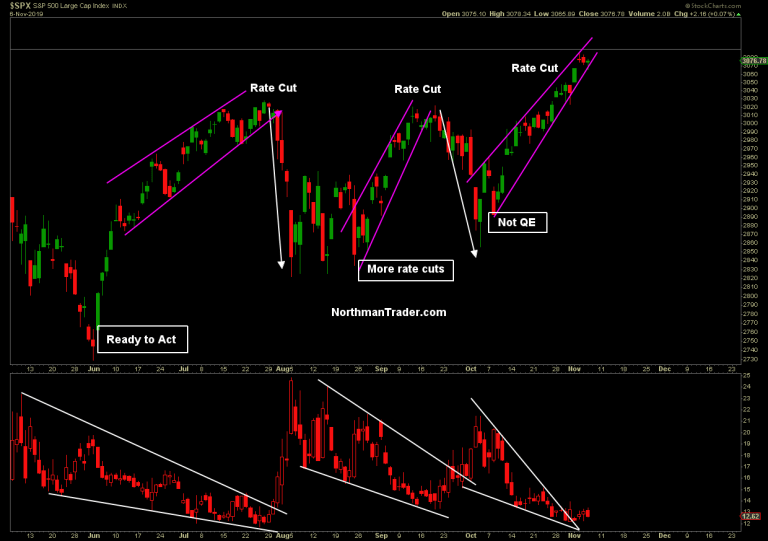
In structure this market is replaying the same script we’ve seen for months now, bottoms on Fed promises and then tight channel rallies in rate cuts that ultimately get sold off:
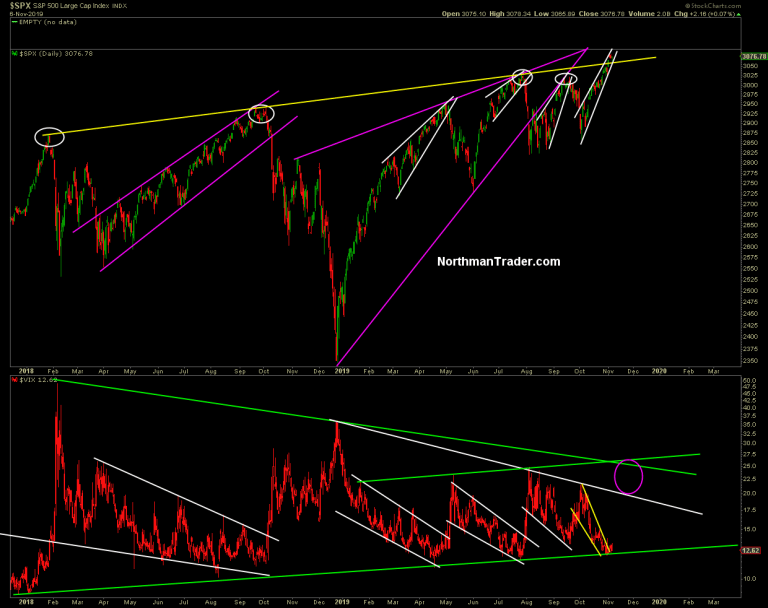
But perhaps the “not QE” program has changed that dynamic as we now move above the trend line:
Yes that poke above the upper trend line, the infamous megaphone pattern. Is that null and void now?
Perhaps, perhaps not. I’ve always said we could have a massive blow-off top on a China trade deal of substance and we keep getting headlines every single day that aim to promise just that. How much of that is real versus a giant bubble show I can’t tell you.
What I’ve said technically is that this pattern need to break out and the breakout needs to be defended on a test. So far it’s not been tested at all.
One primary concern about this rally is that it’s all about overnight gaps. One gap fine, 2 ok, but 5, 6, 7, 8 all unfilled. Getting a bit cheesy especially in the following context:
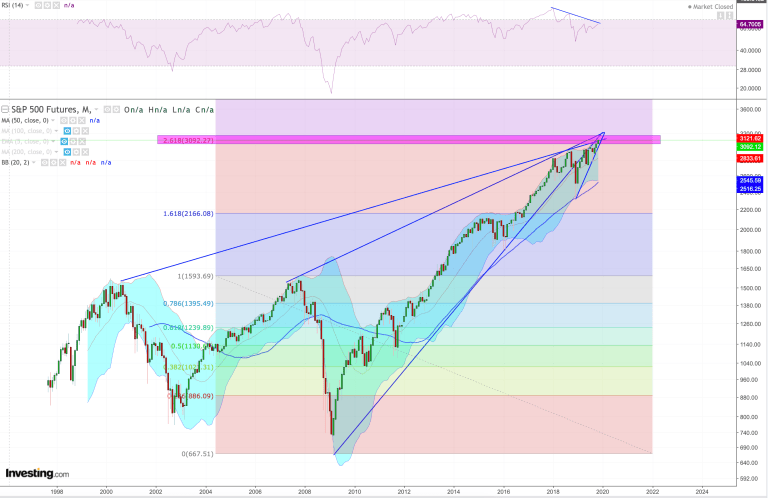
In April I outlined the Combustion scenario, a technical pivot level, the 2.168 fib level on $ES. In Combustion I suggested that there are multiple long time market trends that all look to converge in the October time frame, and the 2.618 fib being one of them.
Well, guess what? We just hit that level in overnight trading on November 7th:
And of course note all the trend lines converging here. You can see it on the linear as well as log charts:
Log version, longer time frame.
All roads have led to here.$SPX pic.twitter.com/PLSa0VoBAr— Sven Henrich (@NorthmanTrader) November 6, 2019
Hence I remain skeptical of the melt-up case. Can I be wrong? Of course. That can happen and given the overwhelming amount of liquidity that’s being thrown at these markets perhaps we should be surprised that we are not even higher yet at this point.
Personally my view is that chasing equities with this backdrop is madness:
What could possibly go wrong?$XLK pic.twitter.com/3ZuizGpGrP
— Sven Henrich (@NorthmanTrader) November 6, 2019
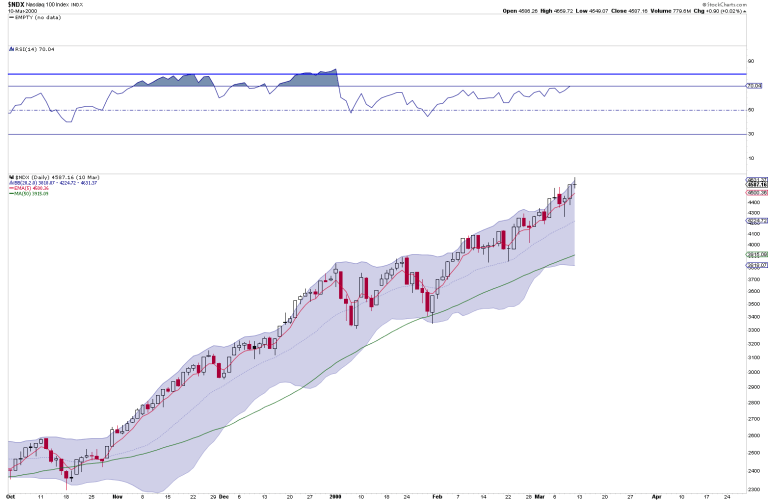
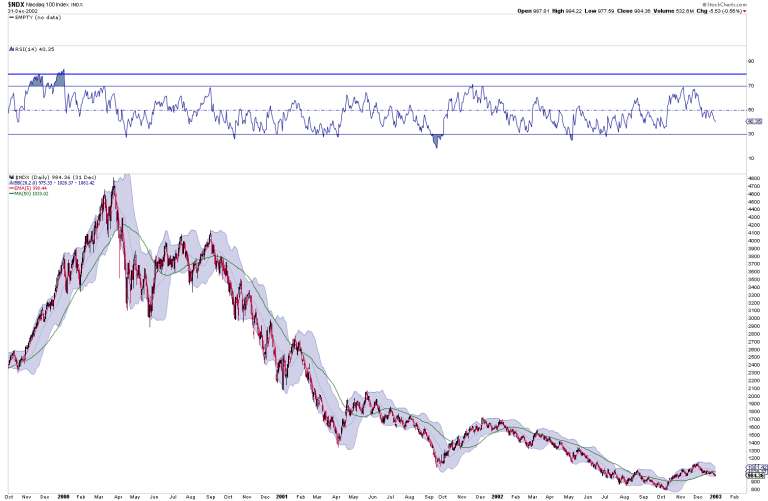
But then I could’ve made the same statement in November of 1999 and not seen a top until March 2000:
Was it correct to call this idiotic back then? Yes. But when has something being idiotic ever stopped humanity from fully embracing it?
Would you’ve gotten run over for 4 months trying to fade this? Yes. Was it the greatest selling opportunity ever? Yes.
But timing is everything.
So I can’t say when this nonsense stops and the consequences of all the excess come home to roost.
In the earlier chart you couldn’t even call a top in early March so steady was the trend. Between November and December there were hardly any dips, mostly just 5 EMA tags and one 50MA/lower Bollinger band tag. A dip to buy for the final run.
I’m not suggesting we face something similar here, but I want to raise awareness that we could and confirmation of an end won’t come easy.
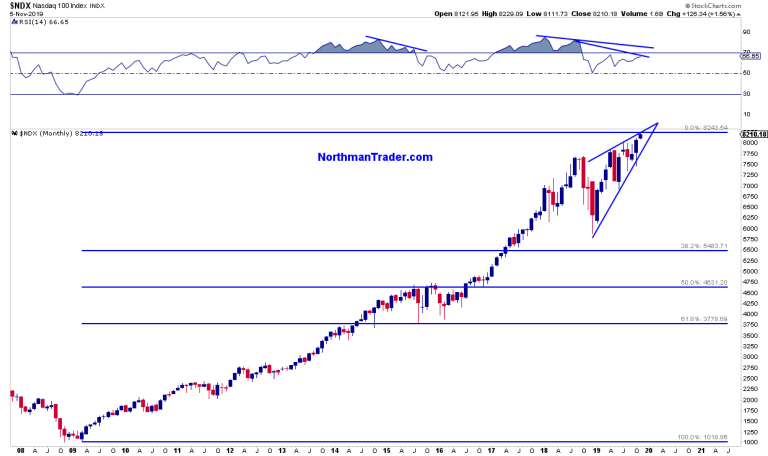
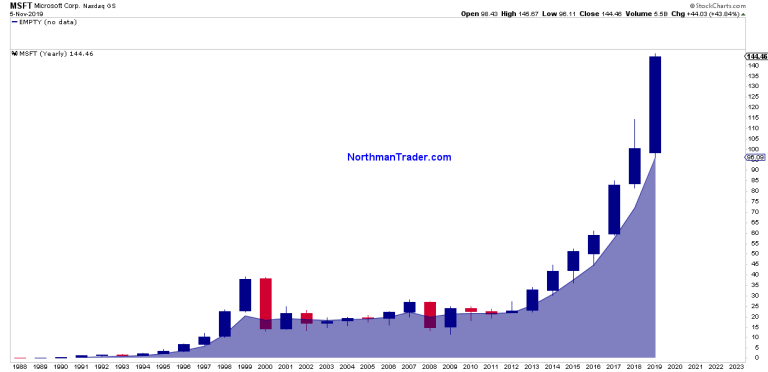
But then I look at stocks such as $MSFT and I see the vast technical excess already all present and I see key technical pivots and points of long term resistance being reached as markets are becoming heavily overbought, extreme greed is pervasive and complacency is the going currency. And it is in this context that we are seeing calls for melt-ups while being a mere 2% above the previous highs.
In 2019 markets have been running on multiple expansion on the Fed put and trade optimism. To expect a melt-up is to also need to see markets break above a 10 year trend, bust above multiple long term trend lines and continue to ignore the underlying earnings picture:
$SPX is reporting a (Y/Y) decline in earnings of -2.7% for Q3 2019, which would mark the 3rd straight quarter of (Y/Y) earnings declines for the index. t.co/DhNgDO6C6g pic.twitter.com/xCtZ9bbyuA
— FactSet (@FactSet) November 2, 2019
$SPX is now projected to report a (Y/Y) decline in earnings in Q4 2019. pic.twitter.com/7o9DOjGHGS
— FactSet (@FactSet) November 4, 2019
I submit that the combination of factors above make this market a highly dangerous environment. In April I called it the combustion scenario. Well, we’re here. At a point of technical importance that reveal the answer to us soon: An artificial liquidity driven melt-up setting markets on a path toward a larger market cap valuation not seen since the 2000 bubble with much larger consequences to come down the road, or will we see technicals take control and force a re-alignment with fundamental reality from here intros general area?
From my perch nothing’s been proven either way yet whether this is a breakout or fake out remains an open question, but I’m also not blind to the grip central banks, the Fed in particular, again have over these markets. We’ll know more once the retest occurs. In my view the $VIX has a coming appointment with the 17 level. The nature of that appointment may well decide everything.
* * *
For the latest public analysis please visit NorthmanTrader. To subscribe to our market products please visit Services.

