Wolf Richter wolfstreet.com, http://www.amazon.com/author/wolfrichter
Where Apartment Rents Fell & Where They Surged: March Update
In San Francisco, the most expensive major rental market in the US, the median asking rent in March for one-bedroom apartments jumped 8.8% from last year to $3,700. This is a new record, beating by $30 the old record set back in October 2015. Median asking rent means half the apartments are advertised at higher rents, half are advertised at lower rents. After that peak in October 2015 came a long trough. By February 2017, one-bedroom rents were down 11% from October 2015. So in March 2019, the trough has been filled.
But in San Francisco’s two-bedroom segment, a different scenario emerges. The peak was also in October 2015, at $5,000. By December 2017, the median asking rent was down 15%. Rents then recovered in spurts and starts, and in September 2018 reached $4,800 — and started declining again. In March, 2-BR rents fell to $4,600, down 8% from the peak in October 2015.
This sort of peculiar noise of rents bumping into sky-high ceilings can be heard in other parts of the Bay Area.
In Oakland, sought-after by San Francisco’s housing refugees, the median asking rent for a 1-BR apartment edged down over the past few months. And in March, at $2,270 was 6% below its peak in April 2016.
Oakland’s median 2-BR asking rent had surpassed its April 2016 peak in December 2018 by $60, but has since dropped. In March, at $2,720 it was down 9% from the December peak.
In San Jose, the median 1-BR and 2-BR asking rents in March – at $2,520 and $3,040 respectively – were down about 1% from the peak last July.
In Southern California, where rents had been soaring over the past few years, a similar scenario emerges, including the sounds of rents bumping into sky-high ceilings.
In Los Angeles, the median 1-BR rent peaked in December 2018 and has since fallen about 4% to $2,330, back where it had been in May 2018; while 2-BR rents, at $3,120, are down nearly 6% from the peak in June 2018 and back where they’d been in August 2017.
In San Diego, the median asking rent in March, at $1,840, was down nearly 6% from the peak in December 2018 and back where it had been in May 2018. And 2-BR rents in March, at $2,400, fell about 5% from December.
In Long Beach, the median 1-BR asking rent, at $1,600, was down a smidgen from its record in June last year; but 2-BR rents, at $2,000, were down 9% from the peak in May, and 5% year-over-year.
In Santa Ana, 1-BR asking rents in March fell 7% from the peak last September, to $1,780. And 2-BR rents fell 3% from their peak in May last year.
The data is based on asking rents in multifamily apartment buildings. “Asking rent” is the amount the landlord advertises in the listing. Single-family houses for rent are not included. Rooms, efficiency apartments, and apartments with three bedrooms or more are also not included. Zumper collects this data from over 1 million active listings of apartments-for-rent in the 100 largest markets. This includes third-party listings received from Multiple Listings Service (MLS). Zumper releases this data monthly in its National Rent Report.
Also not included are incentives, such as “one month free” or “two months free,” which effectively slash the rent for the first year by 8% or 17%. The data includes asking rents from new construction, which other rent reports may not include.
In New York City, asking rents peaked in March 2016. Since then, 1-BR rents have dropped 15% to $2,850, and 2-BR rents have dropped 20% to $3,200.
In Chicago, rents peaked in the fall of 2015. By March, 1-BR asking rents have plunged 25% and 2-BR rents 29%.
The table below shows the 16 most expensive major rental markets. The shaded area indicates peak rents and the changes since then:
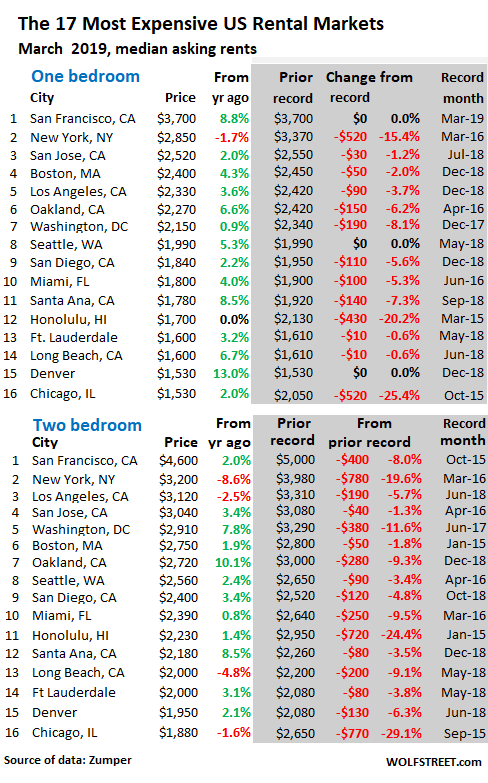
In Honolulu, rents seem to have stabilized last year and so far this year, after plunging from their peak in early 2015. The median asking rent for 1-BR apartments, at $1,700, remains down 20% from that peak, and 2-BR rents, at $2,230, remain down 24%.
In Washington D.C., rents are also marked by sharp declines with 1-BR and 2-BR asking rents down 8% and nearly 12% from their respective peaks in December 2017 and June 2017.
In Seattle, the median 1-BR asking rent in March, at $1,990, matched its record set in May 2018. But 2-BR rents, at $2,560, were down 3.4% from their peak in April 2016.
Clearly, in the most expensive rental markets in the US, rents – particularly those of the more expensive 2-BR apartments – are bumping into ceilings and are bouncing off these ceiling.
Post-hurricane rent-gouge falls apart: In Houston, rents surged after Hurricane Harvey had laid waste to some of the housing stock. By March 2018, the median asking rent for a 1-BR had shot up 12% year-over-year to $1,290 and for a 2-BR by 14% to 1,630. This catapulted Houston into 25th place in the list of the 100 most expensive rental markets.
But in March 2019, rents for 1-BR apartments plunged 12% year-over-year, to $1,130; and rents for 2-BR apartments plunged 14% to $1,400. These were the deepest year-over-year plunges on today’s list (below) of the 100 most expensive major rental markets, and it pushed Houston back down to 39th place.
Many “mid-tier” markets have massive rent increases:
Rents are booming in some “mid-tier” markets – “mid-tier” in terms of the amount of the rent, with many markets showing double-digit year-over-year rent increases. The list of the 100 most expensive rental markets (below) includes 12 with double-digit year-over-year increases in median asking rents for 1-BR apartments:
- #55 – Syracuse, NY: +15.3%
- #61 – Reno, NV: +13.8%
- #44 – St Petersburg, FL: +12.2%
- #50 – Fresno, CA: +11.1%
- #72 – Cleveland, OH: +11.0%
- #87 – Memphis, TN: +10.6%
- #35 – Chandler, AZ: +10.5%
- #58 – Boise, ID: +10.3%
- #83 – Indianapolis, IN: +10.3%
- #26 – Orlando, FL: +10.2%
- #57 – Milwaukee, WI: +10.2%
- #80 – Winston Salem, NC: +10.0%
Below is Zumper’s list of the top 100 most expensive major rental markets, in order of 1-BR asking rents. The percentages are price movements in March compared to March last year. Use the browser’s search function to find a city (if your smartphone clips the right side of the table, hold your device in landscape position):
| City | 1-BR rent | Y/Y % | 2-BR rent | Y/Y % | |
| 1 | San Francisco, CA | $3,700 | 8.8% | $4,600 | 2.0% |
| 2 | New York, NY | $2,850 | -1.7% | $3,200 | -8.6% |
| 3 | San Jose, CA | $2,520 | 2.0% | $3,040 | 3.4% |
| 4 | Boston, MA | $2,400 | 4.3% | $2,750 | 1.9% |
| 5 | Los Angeles, CA | $2,330 | 3.6% | $3,120 | -2.5% |
| 6 | Oakland, CA | $2,270 | 6.6% | $2,720 | 10.1% |
| 7 | Washington, DC | $2,150 | 0.9% | $2,910 | 7.8% |
| 8 | Seattle, WA | $1,990 | 5.3% | $2,560 | 2.4% |
| 9 | San Diego, CA | $1,840 | 2.2% | $2,400 | 3.4% |
| 10 | Miami, FL | $1,800 | 4.0% | $2,390 | 0.8% |
| 11 | Santa Ana, CA | $1,780 | 8.5% | $2,180 | 8.5% |
| 12 | Honolulu, HI | $1,700 | 0.0% | $2,230 | 1.4% |
| 13 | Anaheim, CA | $1,640 | -3.5% | $2,110 | -1.9% |
| 14 | Long Beach, CA | $1,600 | 6.7% | $2,000 | -4.8% |
| 14 | Fort Lauderdale, FL | $1,600 | 3.2% | $2,000 | 3.1% |
| 16 | Denver, CO | $1,530 | 9.3% | $1,950 | 2.1% |
| 16 | Chicago, IL | $1,530 | 2.0% | $1,880 | -1.6% |
| 18 | Providence, RI | $1,510 | 9.4% | $1,580 | 9.7% |
| 19 | Atlanta, GA | $1,470 | 2.8% | $1,810 | -1.6% |
| 20 | New Orleans, LA | $1,430 | 5.1% | $1,530 | 8.5% |
| 21 | Minneapolis, MN | $1,400 | 0.7% | $1,900 | 2.7% |
| 22 | Scottsdale, AZ | $1,380 | 7.0% | $2,080 | 3.5% |
| 22 | Nashville, TN | $1,380 | 5.3% | $1,390 | -3.5% |
| 22 | Portland, OR | $1,380 | 0.7% | $1,660 | 4.4% |
| 25 | Philadelphia, PA | $1,350 | -8.2% | $1,690 | 3.0% |
| 26 | Orlando, FL | $1,300 | 10.2% | $1,490 | 7.2% |
| 27 | Dallas, TX | $1,250 | -3.8% | $1,650 | -6.3% |
| 28 | Baltimore, MD | $1,230 | -6.8% | $1,500 | -1.3% |
| 29 | Charlotte, NC | $1,200 | 4.3% | $1,300 | 0.8% |
| 29 | Sacramento, CA | $1,200 | 2.6% | $1,400 | 0.0% |
| 29 | Madison, WI | $1,200 | 0.0% | $1,400 | 2.9% |
| 32 | Aurora, CO | $1,190 | 6.3% | $1,410 | 0.0% |
| 32 | Austin, TX | $1,190 | 2.6% | $1,470 | 1.4% |
| 34 | Tampa, FL | $1,170 | 2.6% | $1,360 | 1.5% |
| 35 | Chandler, AZ | $1,160 | 10.5% | $1,440 | 15.2% |
| 35 | Gilbert, AZ | $1,160 | 8.4% | $1,410 | 6.0% |
| 37 | Newark, NJ | $1,150 | 9.5% | $1,350 | 8.0% |
| 37 | Plano, TX | $1,150 | 2.7% | $1,510 | 0.7% |
| 39 | Irving, TX | $1,130 | -0.9% | $1,490 | -3.2% |
| 39 | Houston, TX | $1,130 | -12.4% | $1,400 | -14.1% |
| 41 | Fort Worth, TX | $1,120 | 5.7% | $1,270 | 0.8% |
| 42 | Durham, NC | $1,110 | 7.8% | $1,270 | 8.5% |
| 42 | Henderson, NV | $1,110 | 7.8% | $1,290 | 7.5% |
| 44 | St Petersburg, FL | $1,100 | 12.2% | $1,600 | -1.2% |
| 45 | Salt Lake City, UT | $1,070 | 4.9% | $1,370 | 8.7% |
| 46 | Pittsburgh, PA | $1,060 | 1.0% | $1,310 | 2.3% |
| 47 | Richmond, VA | $1,050 | 0.0% | $1,250 | 3.3% |
| 48 | Raleigh, NC | $1,020 | 1.0% | $1,150 | -1.7% |
| 49 | Virginia Beach, VA | $1,010 | -7.3% | $1,200 | 0.0% |
| 50 | Fresno, CA | $1,000 | 11.1% | $1,140 | 8.6% |
| 50 | Jacksonville, FL | $1,000 | 7.5% | $1,080 | 2.9% |
| 52 | Las Vegas, NV | $990 | 8.8% | $1,150 | 9.5% |
| 52 | Buffalo, NY | $990 | 0.0% | $1,180 | 2.6% |
| 52 | Chesapeake, VA | $990 | -4.8% | $1,240 | 3.3% |
| 55 | Syracuse, NY | $980 | 15.3% | $1,050 | 12.9% |
| 55 | Phoenix, AZ | $980 | 3.2% | $1,200 | 5.3% |
| 57 | Milwaukee, WI | $970 | 10.2% | $1,020 | 3.0% |
| 58 | Boise, ID | $960 | 10.3% | $1,100 | 15.8% |
| 59 | Kansas City, MO | $950 | -1.0% | $1,070 | 2.9% |
| 60 | Louisville, KY | $940 | 8.0% | $1,040 | 9.5% |
| 61 | Reno, NV | $910 | 13.8% | $1,310 | 12.0% |
| 61 | Mesa, AZ | $910 | 3.4% | $1,070 | 5.9% |
| 63 | Anchorage, AK | $900 | 4.7% | $1,130 | 2.7% |
| 63 | Colorado Springs, CO | $900 | 3.4% | $1,120 | 6.7% |
| 63 | San Antonio, TX | $900 | 2.3% | $1,120 | -1.8% |
| 66 | Corpus Christi, TX | $850 | -1.2% | $1,070 | 0.0% |
| 66 | Baton Rouge, LA | $850 | -5.6% | $950 | 1.1% |
| 68 | Rochester, NY | $840 | 2.4% | $980 | -2.0% |
| 68 | Omaha, NE | $840 | 1.2% | $1,050 | 8.2% |
| 70 | Laredo, TX | $830 | 5.1% | $940 | 0.0% |
| 71 | Arlington, TX | $820 | 6.5% | $1,090 | 6.9% |
| 72 | Cleveland, OH | $810 | 11.0% | $870 | 8.7% |
| 72 | Des Moines, IA | $810 | 6.6% | $860 | 7.5% |
| 74 | Norfolk, VA | $800 | 9.6% | $990 | 6.5% |
| 74 | Knoxville, TN | $800 | 3.9% | $900 | 3.4% |
| 76 | St Louis, MO | $790 | 5.3% | $1,150 | 8.5% |
| 77 | Glendale, AZ | $780 | 4.0% | $950 | 5.6% |
| 77 | Chattanooga, TN | $780 | 1.3% | $890 | 9.9% |
| 77 | Cincinnati, OH | $780 | -6.0% | $1,120 | 4.7% |
| 80 | Winston Salem, NC | $770 | 10.0% | $830 | 9.2% |
| 81 | Tallahassee, FL | $760 | 8.6% | $880 | 6.0% |
| 81 | Lexington, KY | $760 | 1.3% | $980 | 4.3% |
| 83 | Indianapolis, IN | $750 | 10.3% | $810 | 6.6% |
| 83 | Augusta, GA | $750 | 5.6% | $780 | -1.3% |
| 83 | Spokane, WA | $750 | 5.6% | $900 | 0.0% |
| 86 | Bakersfield, CA | $740 | -2.6% | $940 | 5.6% |
| 87 | Memphis, TN | $730 | 10.6% | $780 | 8.3% |
| 88 | Greensboro, NC | $720 | 5.9% | $840 | 3.7% |
| 88 | Oklahoma City, OK | $720 | 5.9% | $850 | 3.7% |
| 90 | Columbus, OH | $700 | 4.5% | $1,060 | 6.0% |
| 91 | Albuquerque, NM | $680 | 7.9% | $830 | 3.8% |
| 92 | Lincoln, NE | $670 | 9.8% | $890 | 9.9% |
| 93 | Shreveport, LA | $650 | 6.6% | $700 | 7.7% |
| 93 | Tucson, AZ | $650 | -3.0% | $880 | 7.3% |
| 95 | Lubbock, TX | $630 | 6.8% | $770 | 2.7% |
| 95 | Tulsa, OK | $630 | 5.0% | $790 | 5.3% |
| 97 | El Paso, TX | $620 | -1.6% | $760 | -1.3% |
| 98 | Detroit, MI | $610 | 8.9% | $690 | 9.5% |
| 98 | Wichita, KS | $610 | 1.7% | $710 | 2.9% |
| 100 | Akron, OH | $530 | -10.2% | $700 | 0.0% |