Authored by Lance Roberts via RealInvestmentAdvice.com,

Michael Lebowitz previously penned an article entitled “Face Off” discussing the message from the bond market as it relates to the stock market and the economy. To wit:
“There is a healthy debate between those who work in fixed-income markets and those in the equity markets about who is better at assessing markets. The skepticism of bond guys and gals seems to help them identify turning points. The optimism of equity pros lends to catching the full run of a rally. As an ex-bond trader, I have a hunch but refuse to risk offending our equity-oriented clients by disclosing it. In all seriousness, both professions require similar skill sets to determine an asset’s fair value with the appropriate acknowledgment of inherent risks. More often than not, bond traders and stock traders are on the same page with regard to the economic outlook. However, when they disagree, it is important to take notice.”
This is an interesting point given that despite the ending parade of calls for substantially higher interest rates, due to rising inflationary pressures and stronger economic growth, yields have stubbornly remained below 3% on the 10-year Treasury.
In this past weekend’s newsletter, we discussed the current “bullish optimism” prevailing in the market and that “all-time” highs are now within reach for investors.
“Currently, the “bulls” remain clearly in charge of the market…for now. While it seems as if much of the “tariff talk” has been priced into stocks, what likely hasn’t as of yet is rising evidence of weakening economic data (ISM, employment, etc.), weakening consumer demand, and the impact of higher rates.
While on an intermediate-term basis these macro issues will matter, it is primarily just sentiment that matters in the short-term. From that perspective, the market retested the previous breakout above the March highs last week (the Maginot line) which keeps Pathway #1 intact. It also suggests that next week will likely see a test of the January highs.“

“With moving averages rising, this shifts Pathway #2a and #2b further out into the August and September time frames. The potential for a correction back to support before a second attempt at all-time highs would align with normal seasonal weakness heading into the Fall. “
One would suspect with the amount of optimism toward the equity side of the ledger, and with the Federal Reserve on firm footing for further rate increases at a time where the U.S. Government is about to issue a record amount of new debt, interest rates, in theory, should be rising.
But they aren’t.
As Mike noted previously:
“Given our opinions on the severe economic headwinds facing economic growth and steep equity valuations, we believe this divergence poses a potential warning for equity holders. Accordingly, we thought it appropriate to provide a few graphs to demonstrate the ‘smarter’ guys are not on board the growth and reflation train.”
In today’s missive, we will focus on the “price” and “yield” of the 10-year Treasury from a strictly “technical”perspective with respect to the signal the bond market may be sending with respect to the stock market. Given that “credit” is the “lifeblood” of the Government, corporate and consumer markets, it should not be surprising the bond market tends to tell the economic story over time.
We can prove this in the following chart of interest rates versus the economic composite of GDP, inflation, and wages.
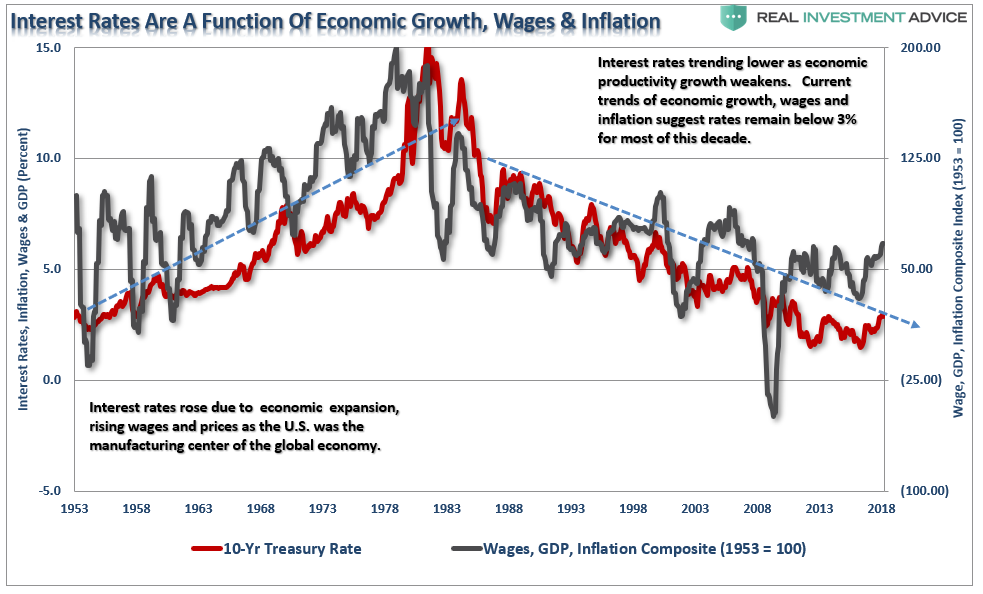
Despite hopes of surging economic growth, the economic composite has remained in an elongated nominal range between 40 and 60 since 2011. This stagnation has never occurred in history and is a function of the massive interventions by the Government and the Federal Reserve to support economic growth. However, now those supports are being removed as the Federal Reserve lifts short-term borrowing costs and reduces liquidity support through their balance sheet reinvestments.
As I said, credit is the “lifeblood” of the economy. Think about all the ways that higher rates impact economic activity in the economy:
1) Rising interest rates raise the debt servicing requirements which reduces future productive investment.
2) Rising interest rates will immediately slow the housing market taking that small contribution to the economy away. People buy payments, not houses, and rising rates mean higher payments.
3) An increase in interest rates means higher borrowing costs which leads to lower profit margins for corporations.
4) The “stocks are cheap based on low interest rates” argument is being removed.
5) The massive derivatives and credit markets are at risk. Much of the recovery to date has been based on suppressing interest rates to spur growth.
6) As rates increase so does the variable rate interest payments on credit cards.
7) Rising defaults on debt service will negatively impact banks.
8) Many corporate share buyback plans and dividend issuances have been done through the use of cheap debt, which has led to increases corporate balance sheet leverage.
9) Corporate capital expenditures are dependent on borrowing costs. Higher borrowing costs lead to lower CapEx.
10) The deficit/GDP ratio will begin to soar as borrowing costs rise sharply. The many forecasts for lower future deficits will crumble as new forecasts begin to propel higher.
I could go on, but you get the idea.
So, with the Fed hiking rates, surging bankruptcies for older Americans who are under-saved and over-indebted, stumbling home sales, inflationary prices rising from surging energy costs, what is the 10-year Treasury telling us now.
Short-Term
On a very short-term basis, the 10-year Treasury yield has started a potential-topping process. Given that “yield” is the inverse of the “price” of bonds, the “buy” and “sell” signals are also reversed. As shown below, the 10-year yield appears to be forming the “right shoulder” of a “head and shoulder” topping formation and is currently on a short-term “buy” signal. Such would suggest lower yields over the next couple of months.

The two signals above aren’t a rarity. The chart below expands this view back to 1970. There have only been a few times historically that yields have been this overbought and trading at 3 to 4 standard deviations above their one-year average.
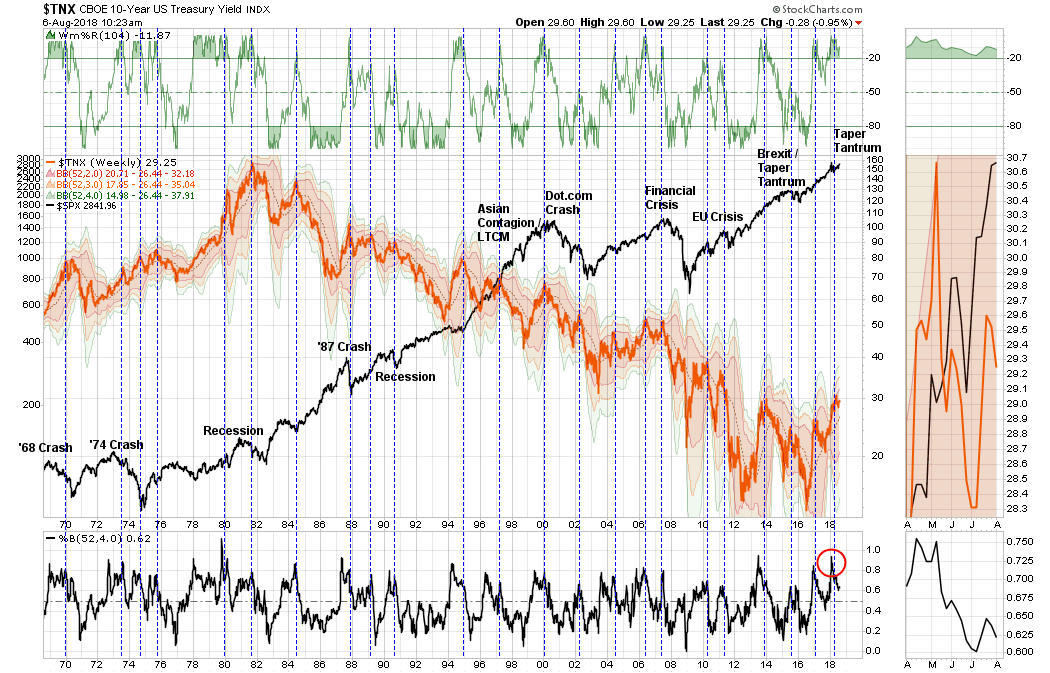
The outcome for investors was never ideal.
Longer-Term
Even using monthly closing data, which smooths out volatility to a greater degree, the same message appears. The chart below goes back to 1994. Each time yields have been this overbought (remember since yield is the inverse of price, this means bonds are very oversold) it is has signaled an issue with both the economy and the markets.
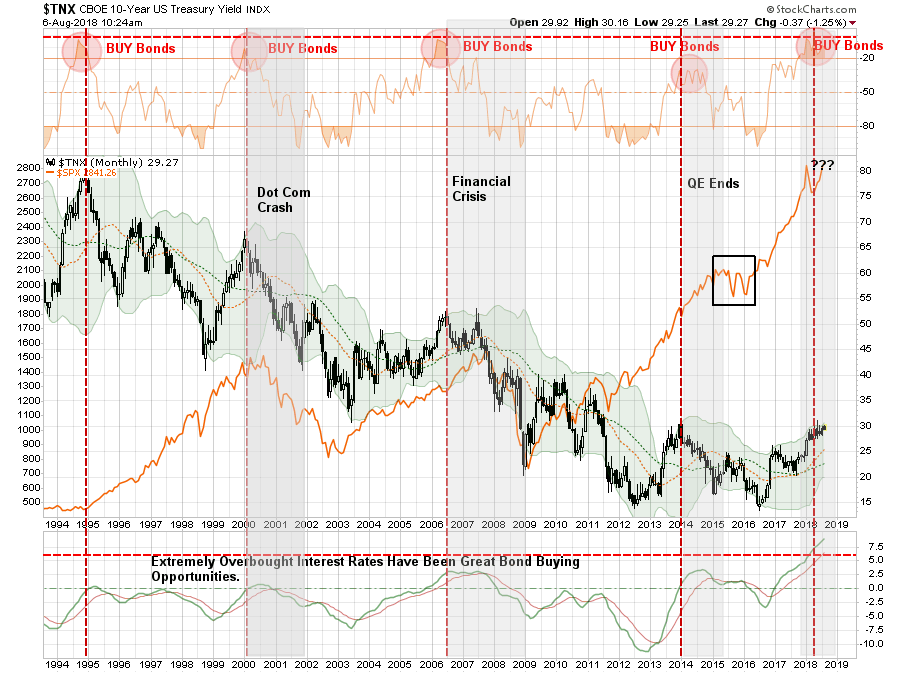
Again, we see the same issue going back historically. Also, notice that yields are currently not only extremely overbought, they are also at the top of the long-term downtrend that started back in 1980.
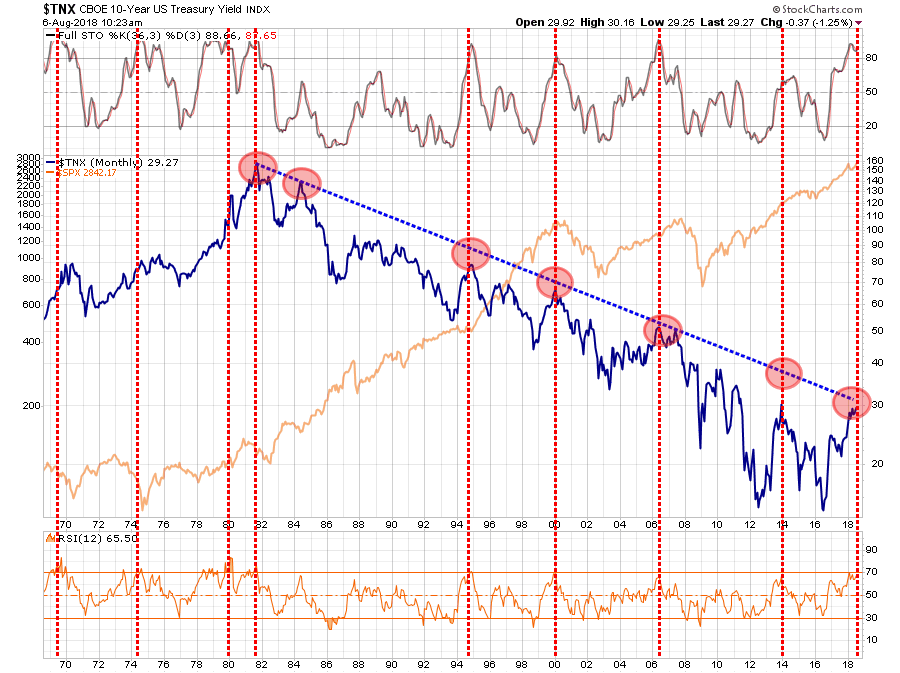
Even Longer Term
Okay, let’s smooth this even more by using quarterly data closes. again, the picture doesn’t change.
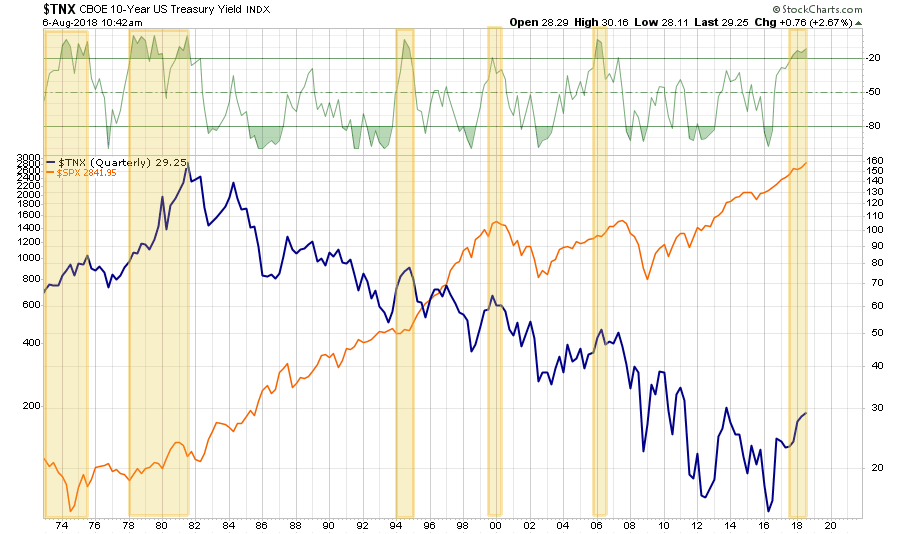
As I noted yesterday, the economic cycle is extremely advanced and both stocks and bonds are slaves to the full market cycle.

“The “full market cycle” will complete itself in due time to the detriment of those who fail to heed history, valuations, and psychology.”
Of course, during the late stage of any market advance, there is always the argument which suggests “this time is different.” Mike made an excellent point in this regard previously:
“Given the divergences shown between bond and equity markets, logic says somebody’s wrong. Another possibility is that neither market is sending completely accurate signals about the future state of the economy and inflation. It is clear that bond traders do not buy into this latest growth narrative. Conversely, equity investors are buying the growth and reflation narrative lock, stock and barrel. To be blunt, with global central banks buying both bonds and stocks, the integrity of the playing field as well as normally reliable barometers of market conditions, are compromised.
This divergence between bond and equity traders could prove meaningless, or it may be a prescient warning for one or both of these markets. Either way, investors should be aware of the divergence as such a wide gap in economic opinions is unusual and may portend increased volatility in one or both markets.”
While anything is certainly possible, historical probabilities suggest that not only is “this time NOT different,” it will likely end the same way it always has for investors who fail to heed to bond markets warnings.
Lance Roberts

Lance Roberts is a Chief Portfolio Strategist/Economist for Clarity Financial. He is also the host of “The Lance Roberts Show” and Chief Editor of the “Real Investment Advice” website and author of “Real Investment Daily” blog and “Real Investment Report“. Follow Lance on Facebook, Twitter and Linked-In