by Dana Lyons

If a comparison to a dotcom foursome holds true, the rally in the vaunted F.A.N.G. stocks may be coming to an end.
Around Thanksgiving time in 2015, we posted what is still among our most popular charts and blogs we’ve ever published. At the time, 2 big things were going on in the equity market. First, it was a tumultuous period for the broad U.S. market as stocks were sandwiched between a pair of 10% corrections. Second, there was one group of stocks that was famously not experiencing any form of tumult whatsoever – the quartet affectionately known as F.A.N.G.
Of course, the acronym FANG stands for Facebook, Amazon, Netflix and Google (Alphabet). At the time, the four stocks were all the rage in the investment world. In fact, a composite of the 4 stocks would have been up roughly 500% in the 3 years leading up to that point. And, despite the rocky footing in the overall market, the FANG stocks were still technically well-positioned for further leadership.
With FANG stocks at dizzying levels, and the broad market looking dicey, we were inspired to write that Thanksgiving 2015 post. In the post, titled Is It Too Late To Sink Your Teeth Into F.A.N.G. Stocks?, we pondered the prospects for further FANG gains. And the context of that pondering revolved around a comparison between the 4 FANG stocks and another prolific foursome of a couple decades prior.
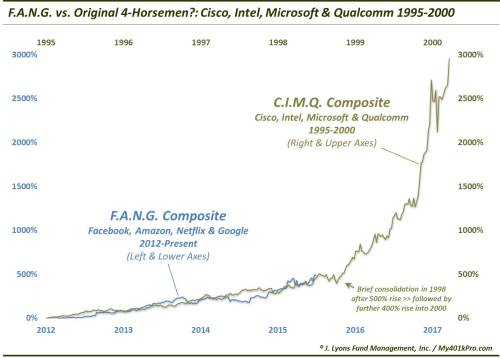
Specifically, we compared the move in FANG to a composite of 4 of the poster children of the dotcom bubble, namely, Cisco, Intel, Microsoft and Qualcomm, aka, C.I.M.Q. But the comparison was between the 2012-2015 FANG stretch and the 1995-1998 CIMQ period. It did not encompass the 2000 bubble top as we had a different point we wanted to emphasize.
As it turns out, the 1995-1998 CIMQ composite experienced a similar 500% price appreciation as the FANG run into 2015, eerily similar in fact. Here is the comparison of the 2 composites that we presented back then.
Or in log form:
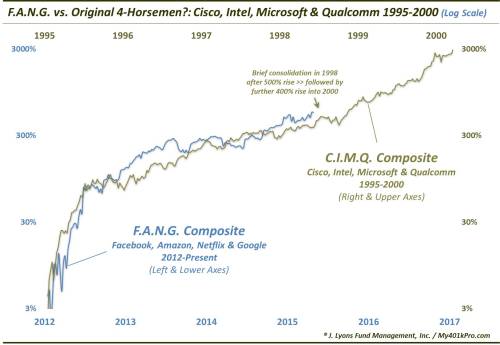
As one can see, the 2 composites had experienced similar, monster 3-year runs. One of the points of our post back then, however, was that while most investors were skeptical that the already stratospheric FANG run could persist much longer, it was indeed still possible. And in fact, it would not be unprecedented. As the chart shows, following a brief consolidation in 1998, the CIMQ stocks, fresh off a 500% rally, would embark on a further 400% rally over the next 2 years into the 2000 bubble top.
Now, 2 years (and a few months) later, we can update the comparison and see if the FANG stocks were able to defy skeptics (and gravity) and continue the march higher like their CIMQ predecessors. As it turns out, they did, to a large extent.
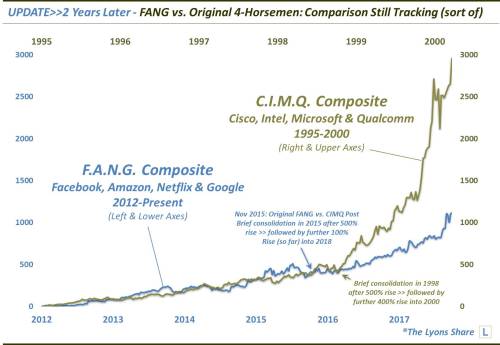
Now again, given the stock market’s meteoric rise over the past 2 years, it may be hard to remember how unlikely most market observers in 2015 thought it was that the FANG stocks would be able to continue to climb for much longer – or at a continued rapid pace. Yet, that is exactly what they have done, doubling from their levels of 2 years ago. That is impressive, and a testimony to the concept of momentum. On the other hand, relative to what CIMQ was able to do, i.e., quadruple, in the 2 years following 1998, it does pale in comparison.
So what now? The FANG stocks still show relatively little inclination to reverse their ascent. However, if the CIMQ analog is still relevant, the cycle may hold some bad news for those still wanting to sink their teeth into FANG. That’s because the 2 year, 400% spurt into 2000 obviously marked the end of the road for the CIMQ rally. Not only that, but the bubble would subsequently burst with a vengeance. By 2 years later, in 2002, the CIMQ composite would be right back down to their 1998 levels. Yes, meaning an 80% decline.
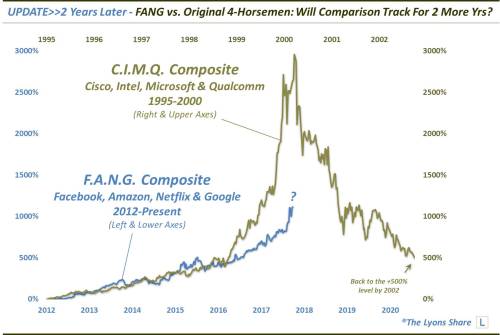
Is FANG destined for a similar fate? Maybe not to that degree, but probably by some magnitude therein. The question is when? We don’t have an answer for that. This is essentially a hand-picked comparison and the FANG path does not have to continue to bear any resemblance whatsoever to CIMQ. It is merely an illustration to show what is possible (i.e., a substantial giveback of FANG gains), despite its seeming improbability.
As we stated in the 2015 post, these studies are not meant as predictions. Rather, the takeaways are more philosophical:
- Trends last longer than one often thinks likely or possible
- The inexorable FANG ascent can, and likely will, eventually suffer an ignominious fate along the lines of CIMQ (though, perhaps not to the degree?)
- The CIMQ phenomenon was a veritable bubble, and despite the considerable rally in FANG (and stocks, in general), it doesn’t come close to the bubbly dotcom conditions
- Comparisons/analogs like this usually lose their relevance as soon as they are discovered, or published (we should take the past 2 years’ semi-accurate tracking record and cut bait!)