by Dana Lyons

One indicator of investor sentiment just recorded its highest reading in history.
Sentiment indicators can be useful tools for investors, mainly on a contrarian basis. That is, generally when readings get overly bullish, it may signal a lack of remaining buyers in the market and vulnerability to a decline in prices. Conversely, when sentiment is extremely bearish, it is often a sign that selling has been overdone and prices are due for a bounce.
In general, there are two types of sentiment indicators: survey-based and real money gauges. We have found surveys to be less reliable than they once were. This may be due to the fact that sentiment is now widely known as a contrarian tool and survey respondents may be hesitant to look like the “dumb money”.
For that reason, we prefer real money sentiment indicators which show what investors are actually doing with their money. Folks can respond however they’d like in a survey, but at the end of the day they vote with their money. Therefore, these types of measures are typically better barometers of true investor sentiment.
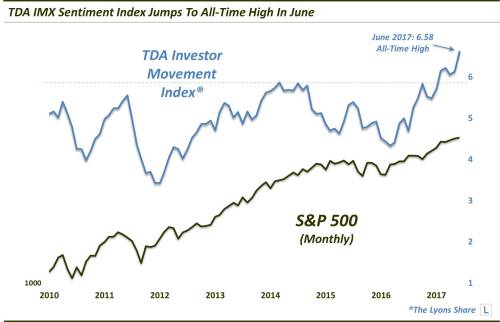
One relatively new real money sentiment indicator is the subject of today’s Chart Of The Day. TD Ameritrade launched their Investor Movement Index® (IMX) the back in 2010 as a way of tracking investor sentiment based upon TDA customers’ money flows. In their words:
“The Investor Movement Index, or the IMX, is a proprietary, behavior-based index created by TD Ameritrade designed to indicate the sentiment of individual investors’ portfolios. It measures what investors are actually doing, and how they are actually positioned in the markets.
The IMX does this by using data including holdings/positions, trading activity, and other data from a sample of our 6 million funded client accounts.”
The reason we chose to make the IMX our Chart Of The Day today is because the latest reading (6.58), as of the end of June 2017, marked the highest reading in the 7-year history of the indicator. Additionally, it exhibited its 3rd largest month-over-month jump ever (+0.45), behind May and August 2016.
Now, before you go selling your entire portfolio, there are few factors that may mitigate one’s concern over this high reading. First off, the indicator is only 7 ½ years old. In market indicator years, that makes the IMX but an infant. It has not even been through a complete market cycle yet. Therefore, we cannot be sure what the indicator is or is not capable of, outside of its very brief history.
Secondly, while the indicator is at an all-time high, the stock market is as well. And if ever there is a reasonable time for sentiment to be at all-time highs, it is when stocks are also at highs. It would be more concerning if the IMX was hitting new highs when it “wasn’t supposed to”, e.g., while the stock market was either declining or at least making lower highs.
For example, one of the larger jumps (+0.41) in the IMX’s history occurred in June 2015 – despite the fact that the S&P 500 lost more than 2% for the month. Of course, stocks were undergoing a significant intermediate-term top at the time and a sharp correction followed soon afterward.
We are not saying that an all-time high in this sentiment indicator is a welcomed data point. It is just that the conditions surrounding the latest reading do somewhat justify it – or at least reasonably explain it. However, we will certainly monitor this new sentiment tool closely in the months to come.