
Dear Investors:
Bear Market Looms
The bear case for US stocks has never been stronger. The set-up looks like January of 2018 when we were similarly bearish yet the market kept screaming higher. Our views were strongly vindicated in February and over the course of the year. The speculative mania of 2019 was wholly unwarranted, not supported by macro indicators, equity fundamentals, or technicals. There is a business cycle after all, and it is poised turn down as it always does. It’s timely for investors to be aware of the gravity of the situation today.
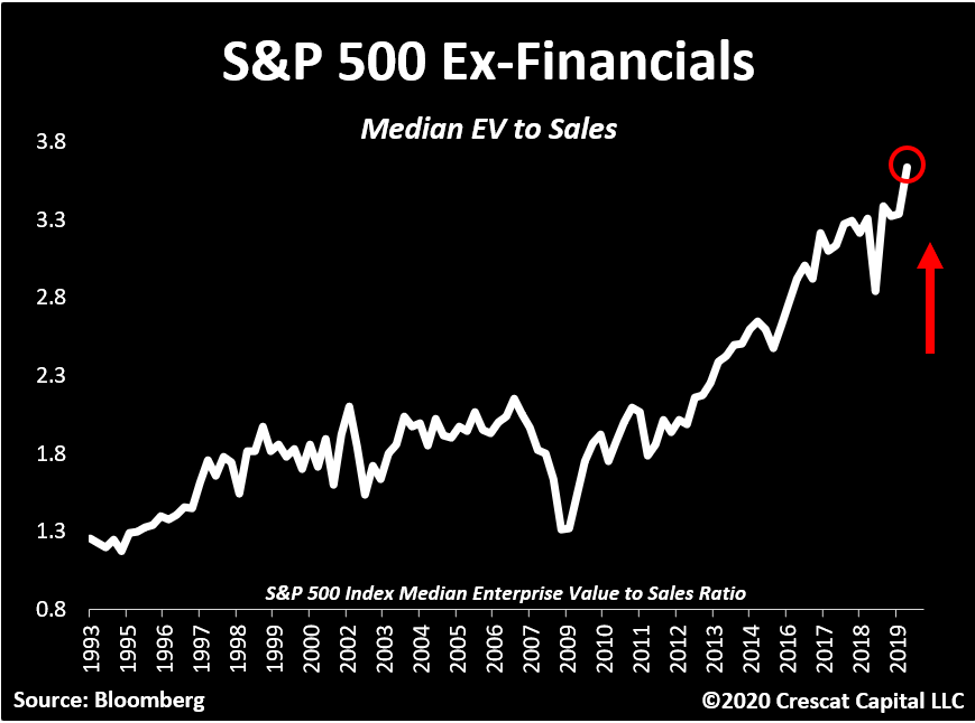
We certainly did not predict the Coronavirus, but it may prove to be the catalyst to tip this market that is trading at truly historic valuation levels after a record long US economic expansion. Median EV to sales for the S&P 500, based on our work recently reached an insane, euphoric level of 3.6 times, two times than the tech bubble peak.
A top this month would certainly make sense to us given the recent overbought conditions, unsustainably high bullish sentiment levels, bear capitulation (not Crescat), and deteriorating macro indicators.
As the downturn gets going, we think a critical mass of investors will finally be waking up to the facts about the market’s overvaluation. We hope to educate people ahead of that. The problem is that to date, too many have been focused on P/E ratios that have been misleading. They think the market P/E ratio can still go higher because it has been in a rising trend and has not yet re-tested its prior tech bubble highs yet. The forward P/E for the market is still high at recent 18.4 times and in the 88thpercentile historically. However, the much bigger concern is the abundance of more comprehensive valuation measures that are already at all-time highs, in the 100% percentile, higher than comparable stock market mania peaks in 1929 and 2000.
Record Valuations
The problem is that P/E, even Shiller’s cyclically adjusted P/E ratio (CAPE), is a potential value-trap measure in the current economy because of three issues:
- Profit margins are unsustainably high today, not only within this business cycle but compared to other business cycles making P/E ratios understated;
- The P/E ratio completely ignores debt in its valuation, not a good idea at a time when corporations have record leverage; and
- The most common measures of total market P/E use the mean rather than median company valuation which understates the average company’s multiple today by putting more weight on bigger, more profitable companies – the median better captures the valuation of the breadth of the market.
We believe median enterprise value to sales is one of the best measures to understand the extent of the bubble in the stock market today compared to history. By looking at sales and not earnings, we control for today’s likely fleeting, record high profit margins. And because EV includes debt as well as equity in the total valuation of the company, it properly reflects the valuation of the business. Finally, our focus on the median company’s valuation illustrates the breadth of the valuation extreme in the market today.
The average investor does not need an advanced finance degree to understand these valuation points. But they should invest a little time reading our letters and focusing on our macro charts to understand the grave risks as well as genuine opportunities today. It is a worthy endeavor to avoid getting caught up in the popular delusions associated with late cycle market euphoria. We believe investors will need a good grounding in valuation and business cycle analysis to reject the common buy-the-dip advice that is soon to become prevalent in the still early stages of what is likely to become a brutal bear market.
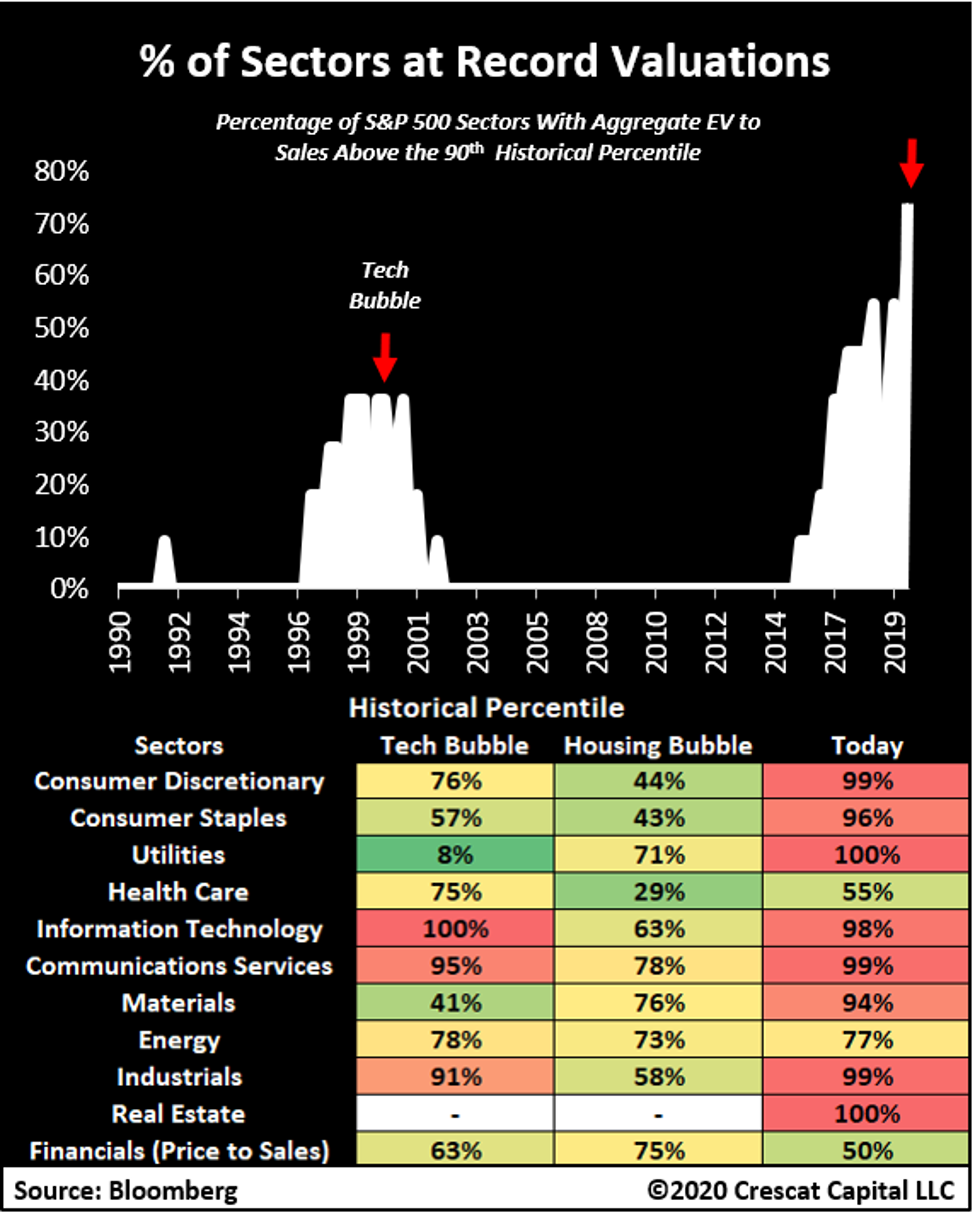
Below is another way to visualize the current market valuation extremes to understand the risks of a severe market downturn ahead. Here we look at each sector of the S&P 500 and compare its valuation today to compared to prior market peaks in the tech and housing bubbles in 2000 and 2007. We can see that an unprecedented 8 out of 11 sectors are at top-decile, historical valuations illustrating the breadth of the current market excess.
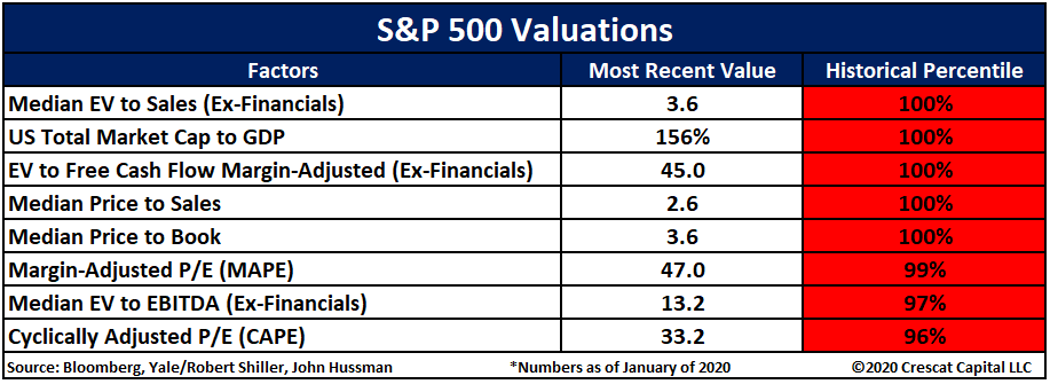
Below we show the gamut of measures currently at record high fundamental valuation for the market at large based on their historical percentile ranking. Data for MAPE and CAPE ratios go back prior to 1929! The other measures are based on the entire history of available data which goes back at least two and half business cycles:

Bulls’ False Hope in Low Interest Rates
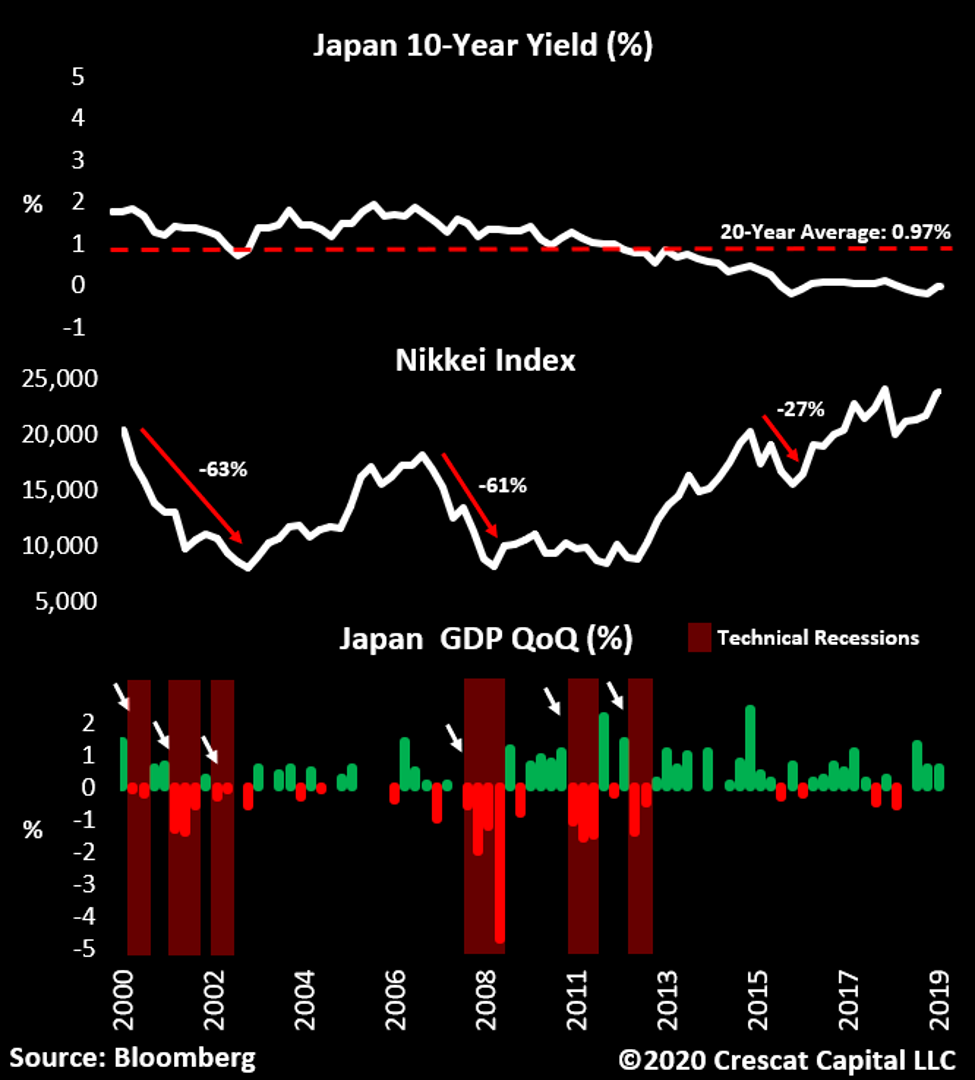
A common argument today is that low interest rates justify today’s high equity valuations. That is not true at all. When low interest rates are due to low growth and excessive debt, as is the case today, no valuation premium is justified. We debunked the low interest rate argument in a past letter based on historical empirical data for the entire US stock market. Let’s set the record straight once and for all with this example: If low interest rates are the reason for why we can’t have an economic downturn, then how did Japan have six of them after its 10-year yield went below 2% in the last 20 years? We show this in the chart below. Japan’s low rate environment included two 60+% drawdowns in stocks while its debt service ratio was even lower than in the US today. These recessions and bear markets all happened during massive QE periods as well.
So much for the bulls’ Fed liquidity argument today. Whatever the Fed prints is counterbalanced by and necessary to deal with the world’s $250 trillion debt (anti-liquidity) problem that is also historically high relative to global GDP. Central banks are typically more reactive than pro-active and are only likely to bring out the big guns after the bear market and recession is in full swing. The Fed is between a rock and a hard place. If it brings out the guns too early, it can spur inflation that can also catalyze an economic downturn and stock market crash. Ultimately, we believe inflation is in our future, especially after the Fed inevitably comes in with a bazooka of some sort, which it certainly will, but likely not in the biggest way until after equity asset bubbles have already burst and the economy is in a real economic decline. In the meantime, we want to play inflation with precious metals today which tends to work in advance of inflation and during equity bear markets as well as during the actual inflationary times. Both deflation and inflation are depressive to stock market multiples by the way.
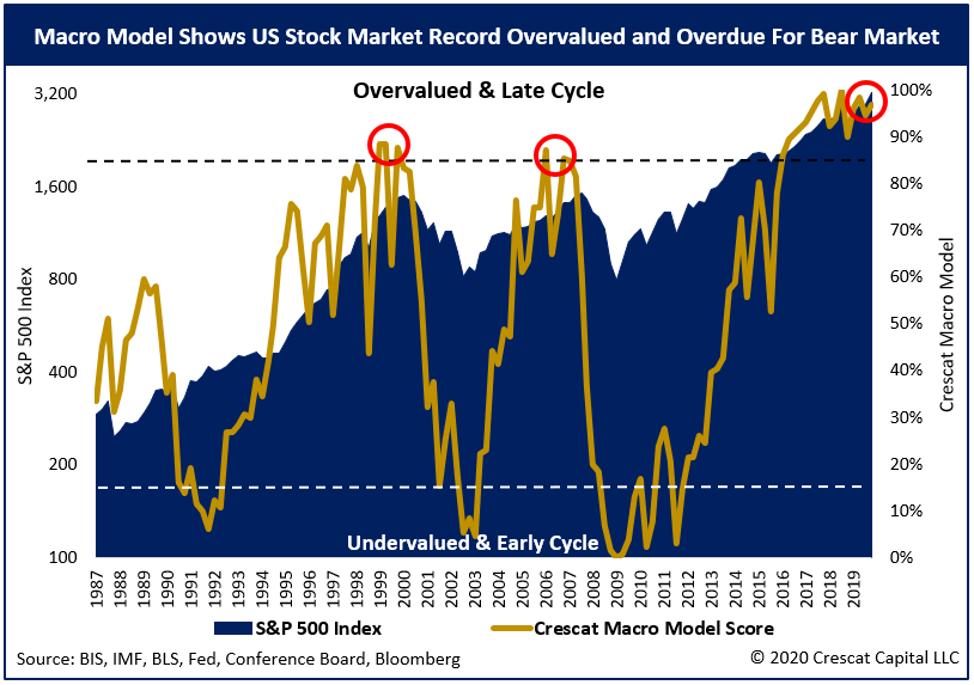
Crescat’s Macro Model
At Crescat, we have a macro model that is signaling a high probability of an oncoming bear market and recession in the near term. Our model includes four of the valuation measures above plus twelve business cycle indicators such as employment and consumer confidence (contrarian indicators), yield curve inversions (historically infallible), and other proprietary factors:
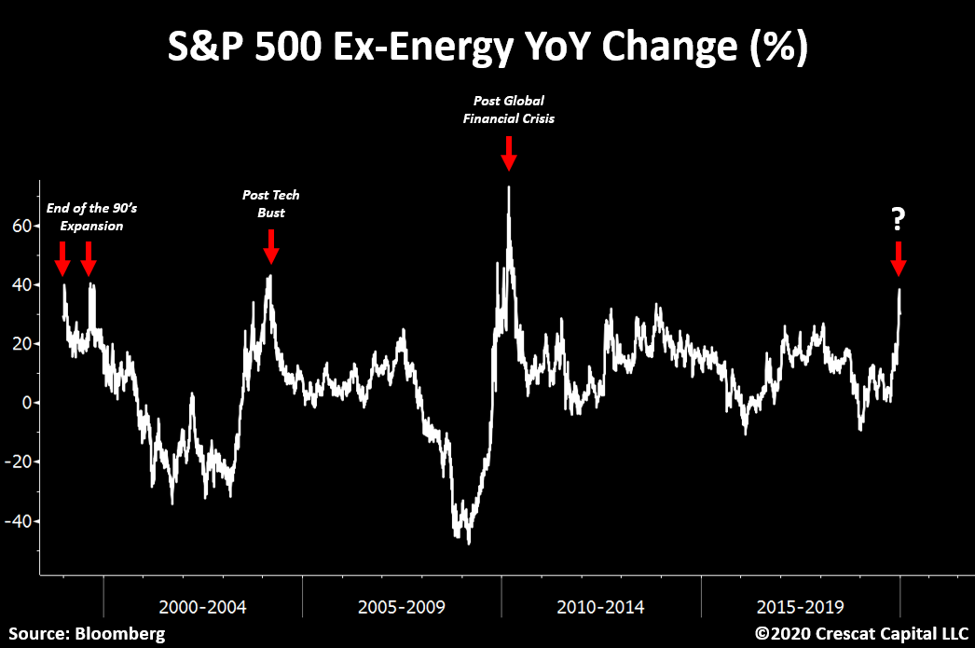
S&P 500 Acting Like a Major Top
The S&P 500 Index excluding energy is up close to 40% on a year-over-year basis. This type of price behavior only happens at business cycles peaks or after major stock market bottoms coming out of a recession. Given the extent all the macro imbalances in the US and worldwide, we strongly believe it is the top, not the bottom, of the business cycle! Today’s market fundamentals and price distortions have uncanny similarities to the tech bubble top in 2000.
Yield Curve Inversions
Keep in mind, that Crescat’s most reliable recession harbinger already flashed a warning signal several months ago when the percentage of inversions in the Treasury yield curve surged above 70%. This indicator is Tavi Costa’s very own invention. We believe it is more robust than common yield curve inversion models. While it is a back-tested model, and it could be “different this time”, it has perfect history of predicting prior economic downturns since 1970. We show Tavi’s model below.
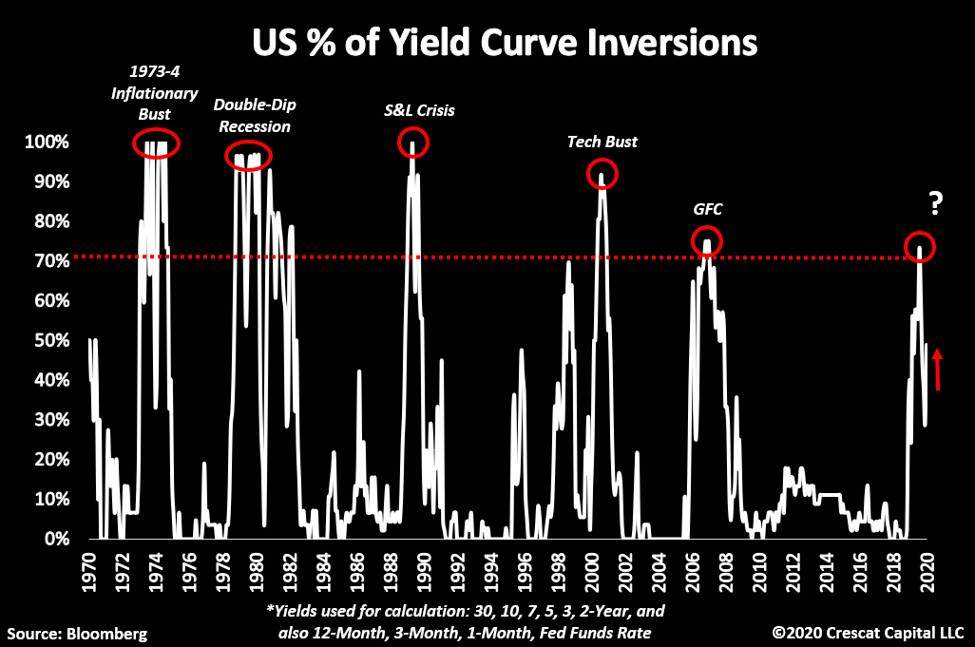
While the percentage of yield curve inversions above 70% already triggered and that is the key signal, it subsequently fell as it normally does going into a recession. It has been rising again and it’s now close to 50%. We mention this because the last time this indicator was rising it became a major reason for the Federal Reserve to start easing again. We have already seen three 25 basis points rate cuts plus $400 billion of new money added to the Fed’s balance sheet. Meanwhile, the repo market liquidity crisis hasn’t been fully averted. These inversions are creeping up again and the Fed is already running an extremely hot monetary policy by traditional standards with core and median CPI at decade highs.
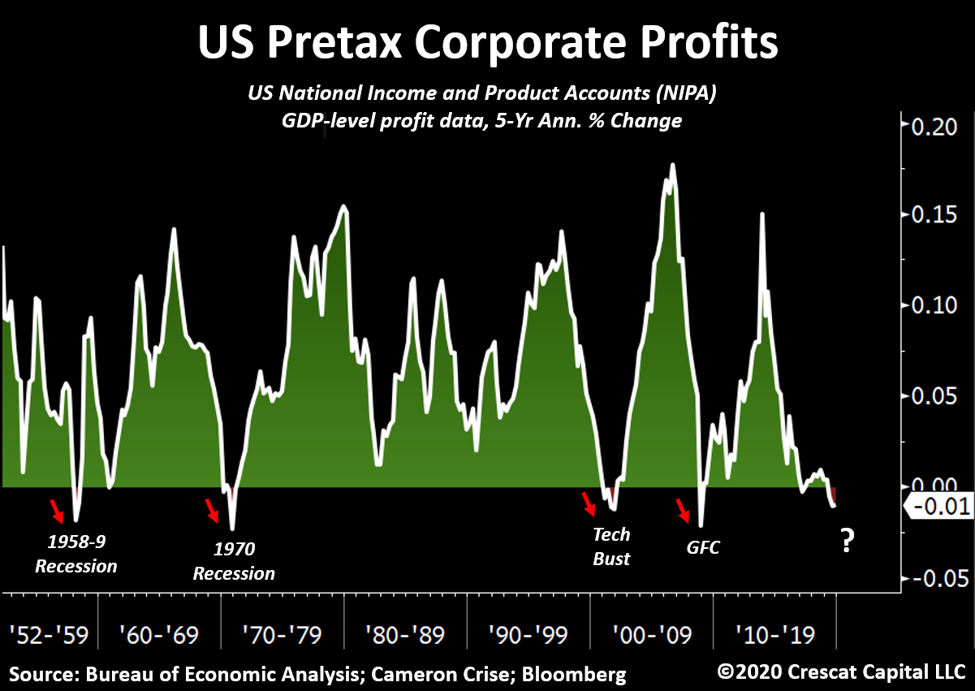
NIPA Profits Contraction
Another factor not currently in our model, but that could be, is change in US economy-wide corporate profits based the US National Income and Product Accounts (NIPA). If the bull case for stocks and the economy is that corporate profits are poised to scream higher, the GDP-level profit data tell a completely different story. If this were really the greatest economy ever, American business profit growth would not have been grinding lower for the past five years. And it would not have just turned negative. But it did. As we show in the chart below, every prior NIPA profits’ recession of the current magnitude bled into a full-blown economic one. NIPA profits normally track S&P 500 profits. The last time NIPA diverged from S&P 500 profits in the way it has today, it was the peak of the tech bubble.
One big difference in how profits reported in company financial statements versus how they are counted by the BEA is the treatment of capital gains. The implication is that a significant amount of earnings growth that the S&P 500 has exhibited in recent years might be due to investment gains rather than the underlying strength of operations. S&P 500 profit margins thus aren’t a strong as they appear and may be poised for a cyclical decline leading to recession as in past business cycles.
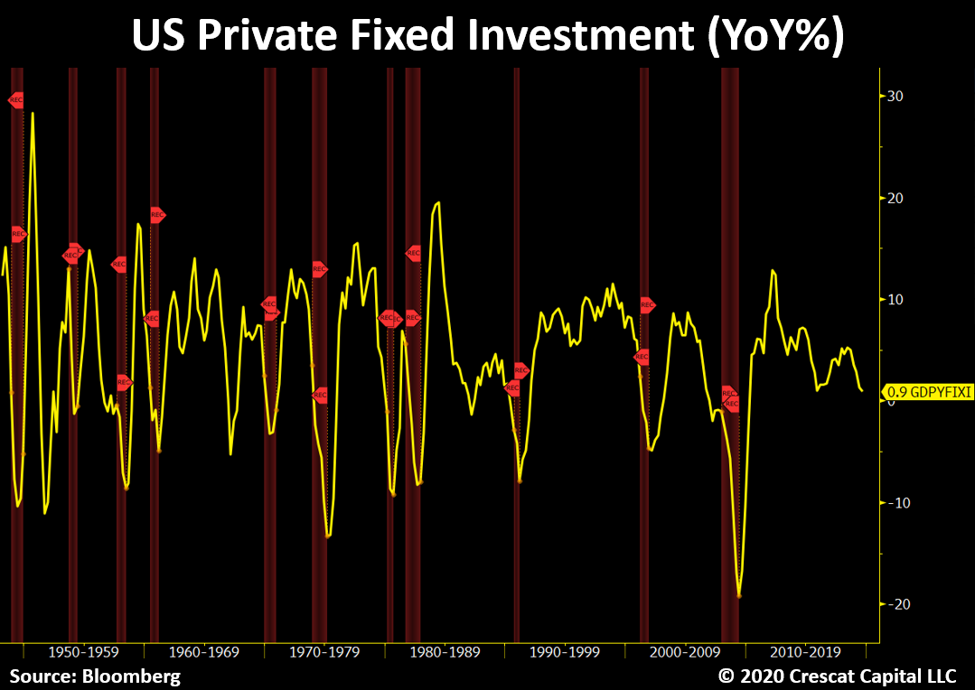
Fixed Investment Collapsing
Similarly, corporate investment for the US economy as a whole has been slipping and does not bode well for future corporate profit or economic growth. Note the late-cycle declining trend in year-over-year fixed investment growth and how this prior pattern led to outright CAPEX declines and recessions except in a few mid-cycle soft landing situations. We are extremely late in the economic expansion cycle today.
Serious Cracks in the Labor Market
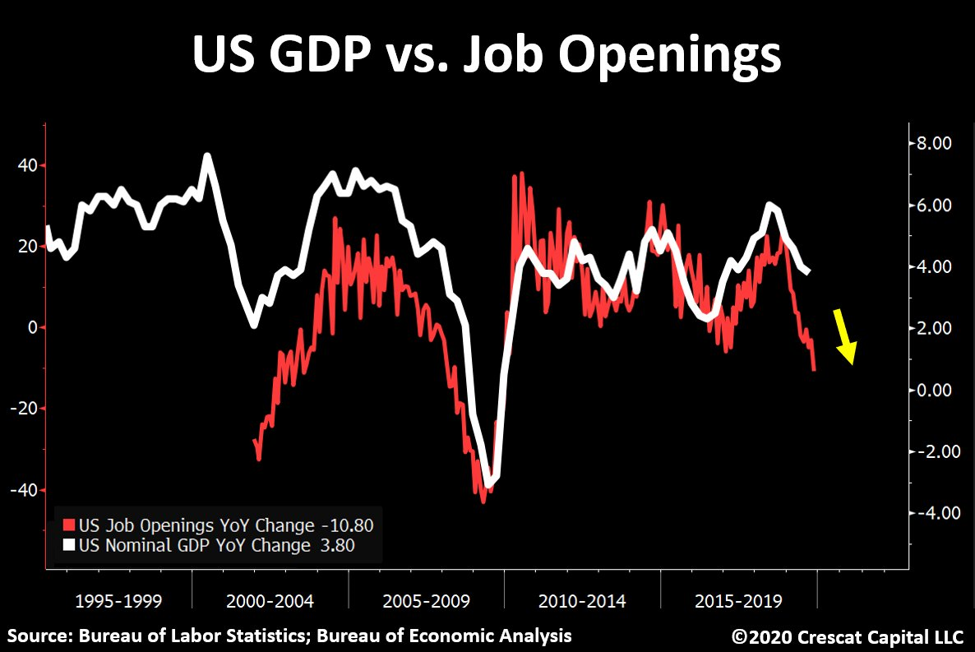
The labor market is a critical part of the business cycle paradigm and is undeniably deteriorating. The latest job openings number confirmed again its declining trend. It is now falling by over 10% annually. As shown below, this indicator follows GDP growth very closely throughout history, and suggests even further deceleration in the economy. In line with these issues, CFO and CEO confidence remains at remarkably low levels while broad equity earnings that continue to contract on a year-over-year basis. These ruptures on the macro level are now daunting record overvalued stocks at the peak of business cycle.
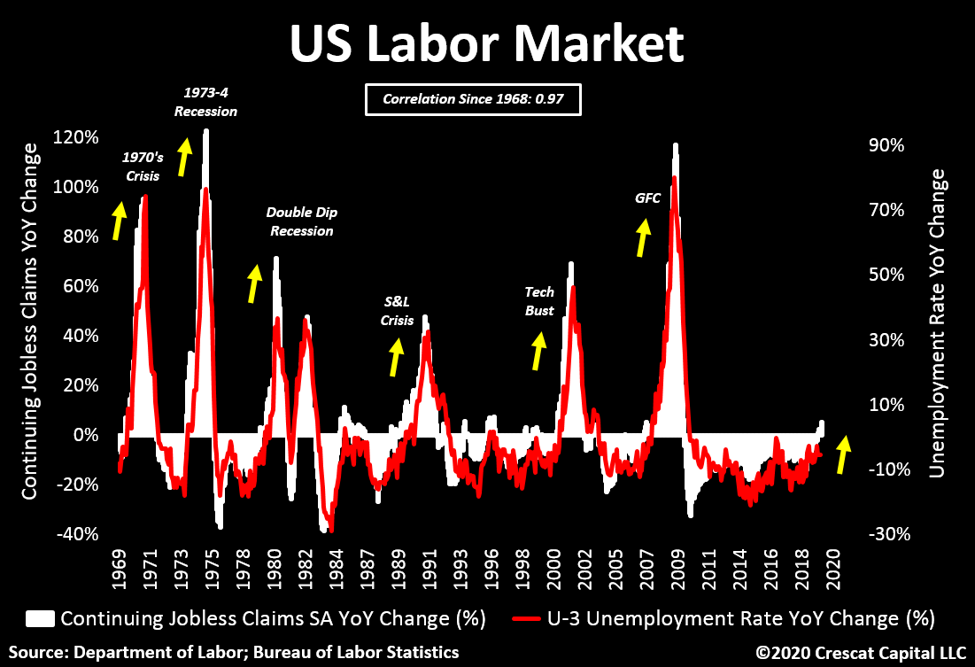
We recently had another predicament. Continuing jobless claims are now rising the most since the Great Recession. This index tracks the unemployment rate with an exceptional 0.97 correlation since 1968. Keep this in mind as the labor market holds the key for the business cycle.
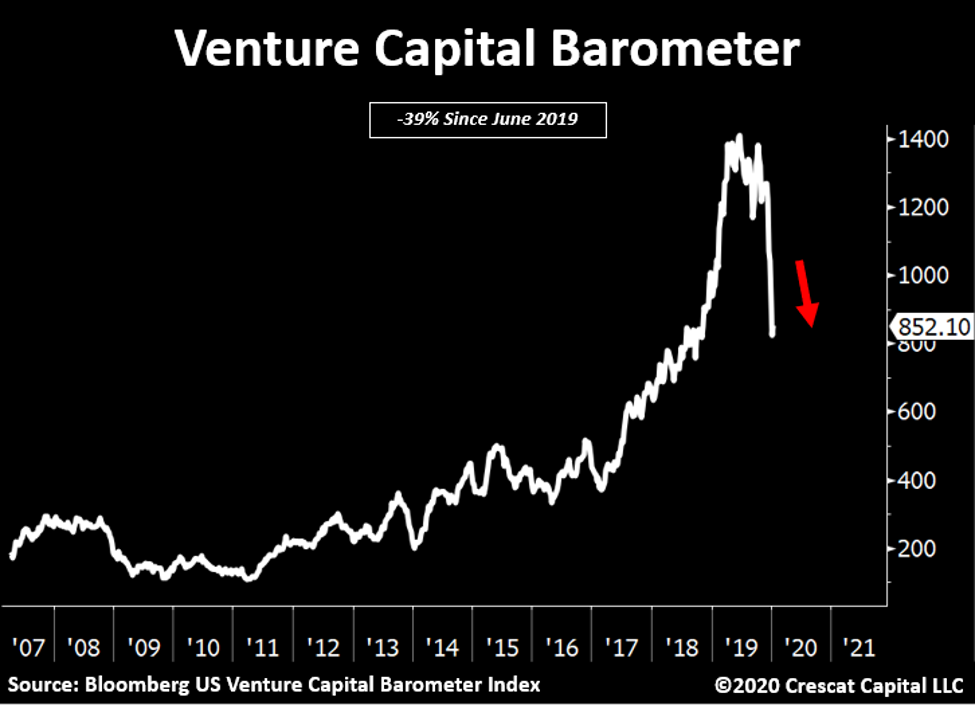
VC Health Collapsing
We also noted recently this venture capital (VC) barometer now in complete free fall, down close to 40% from its peak in June 2019. VC deal volumes are down 24%, while deal exits just plunged 35%. This industry is the poster child for the imbalances we see in this cycle. Loads of easy money fueling loss-making businesses at inflated valuations. It’s yet another sign of a market peak and reminiscent of the tech bust.
The Case for Precious Metals
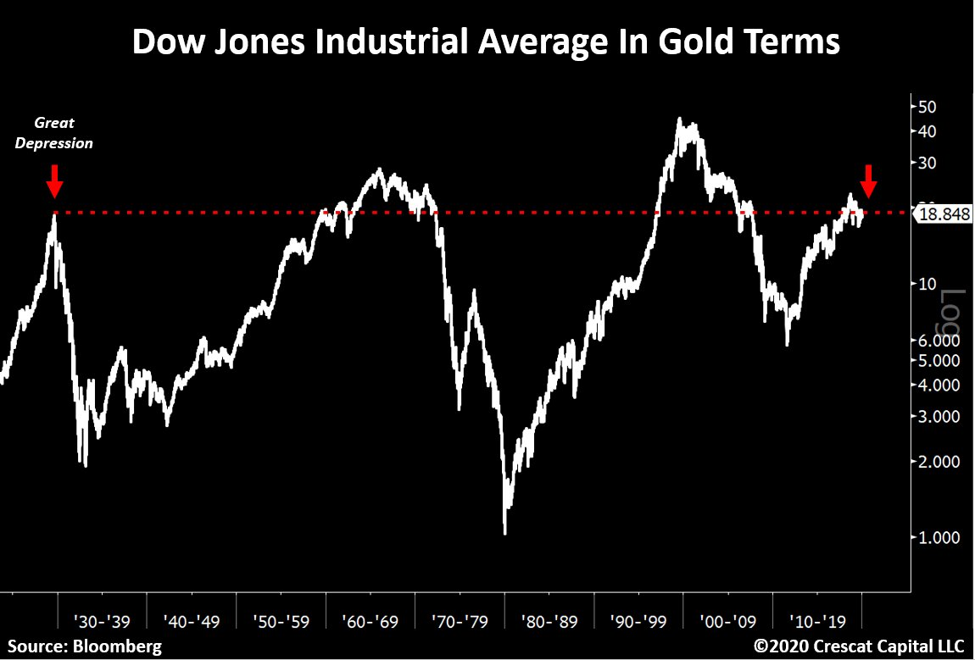
Interesting enough, if you price the Dow Jones in gold terms, it’s today at the exact same level it reached right before the Great Depression. These are just further evidences of the levels of frothiness achieved in equity markets today.
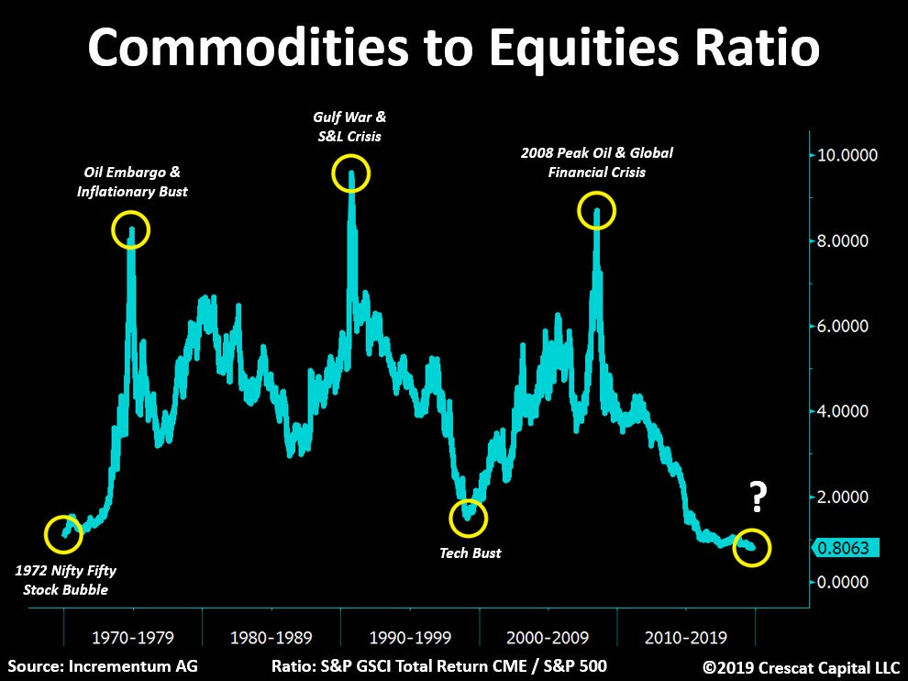
Commodities are perhaps the only asset class where investors can find deep value today. Their depressed valuations are most likely a sign of global recessionary forces building and coming principally from China with its unsustainable currency and credit bubble on the precipice of bursting. Precious metals remain our primary focus in the commodity space. They are far and away our largest long allocation when it comes to positioning across all Crescat strategies. From physical gold, silver, or platinum, to mining stocks, the entire space looks extraordinarily appealing as the likely early first mover in the commodities asset class.
In an environment of suppressed investment yields, record overvalued stocks, central banks expanding balance sheets globally, and rising geopolitical tensions, it’s challenging to find attractive “long” investments. The entire US Treasury curve has negative real yields. Broad corporate equities based on the Russell 3000 just went into earnings recession last quarter on a year-over-year EPS basis and are at all-time highs with record valuations. Utilities’ dividend yields are only 40 basis points (bps) over inflation rates but dividends are not covered by free cash flow so are at risk of being cut. Meanwhile utilities have record debt and valuations. REITs offer only 30 bps of premium to inflation and also have high valuations and leverage. Junk bonds (excluding energy companies) have their worst real yield in history. Investment grade bonds present the same problem. Even emerging markets corporate bonds only yield about 2.8% these days.
With valuations of financial asset so frothy relative to inflation, commodities are the only value-oriented asset class in the market. They have been left for dead in the current business cycle. We believe commodities are setting up for a generational buying opportunity. Energy, including oil and gas, looks interesting in the longer term though could also get caught up further in a China-led downturn unless there is a geopolitical supply shock, a possibility given the situation in the Middle East. As well, there is the strong possibility for a medium-term supply shock due to under-investment and a realistically longer transition to renewables than hoped for among clean energy advocates.
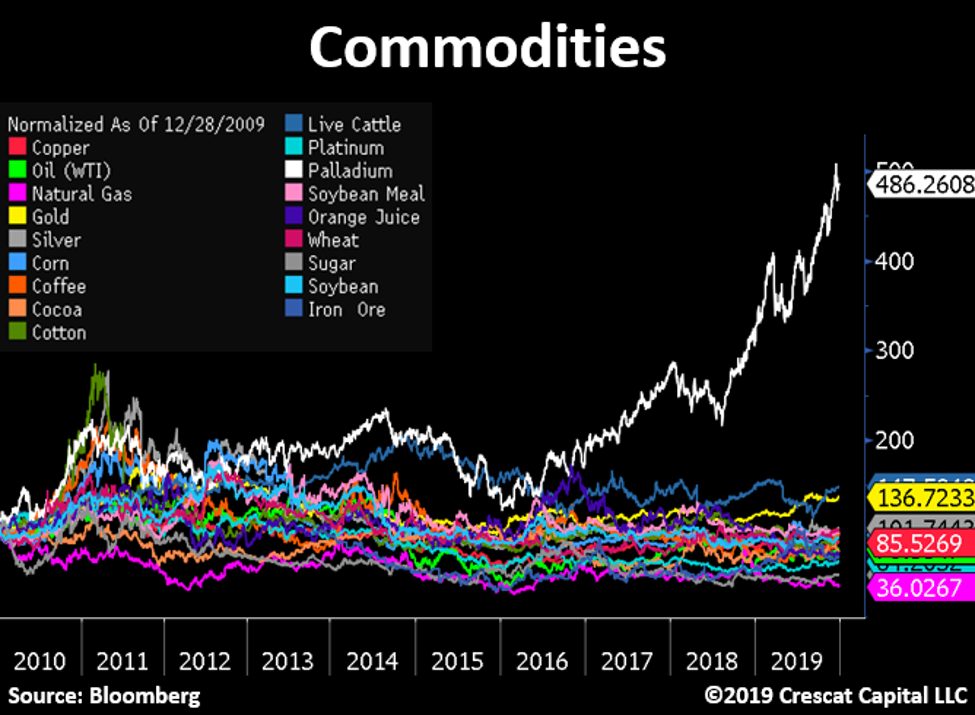
We strongly believe that low commodity prices are the major reason for why we haven’t seen high reported inflation yet. Sure, some inflationary signs have already been evident such as health care and college tuition. However, the large bulk of consumer prices remain tempered. This phenomenon, aside from demographics and recent technological shifts, is mostly attributed to the tremendous underperformance of commodities. Aside from palladium, this entire space has either been in a bear market or just slightly up for the last 10 years. We highly doubt the next decade will look the same.
A change in overall commodity prices, including supply disruptions as have seen throughout history, could largely affect the cost of capital structure for the entire financial market. Equity and credit markets are not priced for a rising inflationary environment today. Inflation is the endgame for endless central bank liquidity, consumer confidence, and the labor market.
China
Coronavirus is a real threat coming from China that has caused global stocks to be down 5 out of the last 7 days since January 17, but the overall decline has still been minimal. The bigger contagion likely to spread from the world’s biggest communist experiment is a financial one, a Chinese credit pandemic. We are talking about the unwinding of China’s $40 trillion totalitarian banking system that finally appears to be underway. It not just a credit bubble, it could be an outright Ponzi scheme of unprecedented worldwide economic scale. As our chart below shows, China’s banking assets grew from 9% to an insane 50% of global GDP over thirteen years where it topped out in early 2018. As we have been pointing out for several years now, China’s bank credit expansion is the largest financial asset bubble in recorded history. Our analysis shows that it is now in the early and globally contagious phase of bursting and will almost certainly lead to a currency crisis.
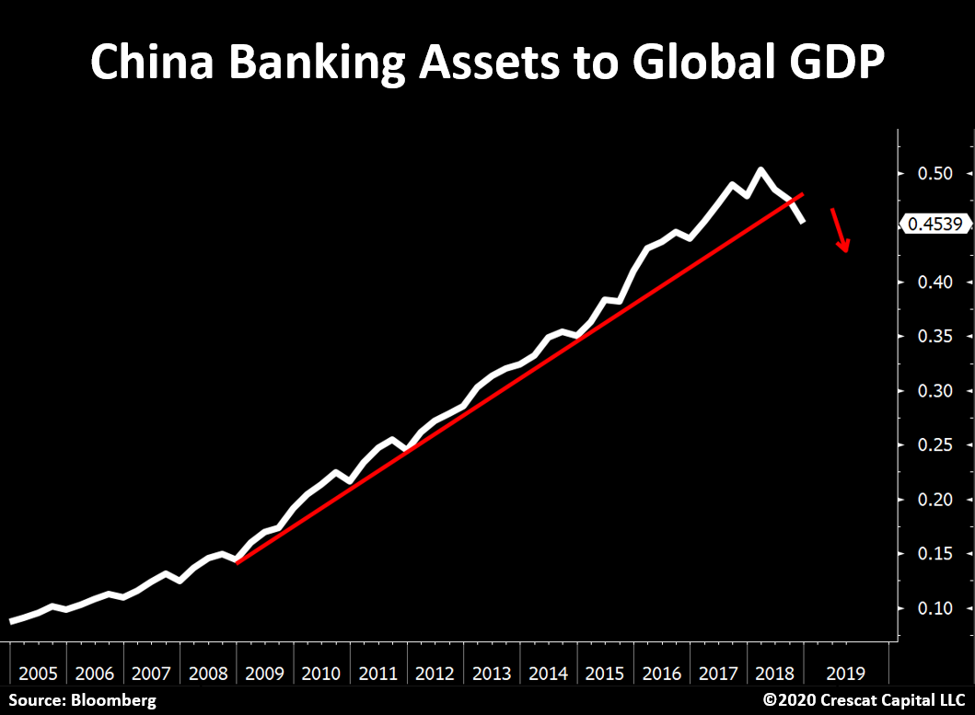
China’s miracle growth in the last decade plus has come from rapid but unsustainable growth in its banking system. Over this period, state-owned banks continuously made new loans to enterprises that based on our analysis could not otherwise pay back their existing ones with underlying free cash flow. As a result, China’s banking assets are massively overstated due to a ballooning unrecognized non-performing loan problem, likely in the multi-trillion USD range. The calamity begins when China’s banking assets relative to global GDP can no longer grow. That is the case today as our chart above shows. What this means is that China’s Minsky Moment is finally at hand. The bursting of the Chinese currency and credit bubble has been a long time coming. Remarkably, the investing world at large is still oblivious to the scale and scope of China’s financial imbalances and their likely infectious impact of their unwinding on other asset bubbles and economies worldwide.
China continues to attract gullible Western savings into its vortex. The West is so easily deceived that even the Phase 1 trade deal between the US and China unbelievably includes an agreement by the US to buy China’s non-performing bank loans, not a smart investment in our view. At the same time, oblivious Western financial advisors continue to recommend passive emerging market equity and debt in clients’ portfolios when China makes up 30% of the MSCI Emerging Markets Index. As we have seen with every surprise mini-devaluation of the yuan already since 2015, China’s financial problems are contagious.
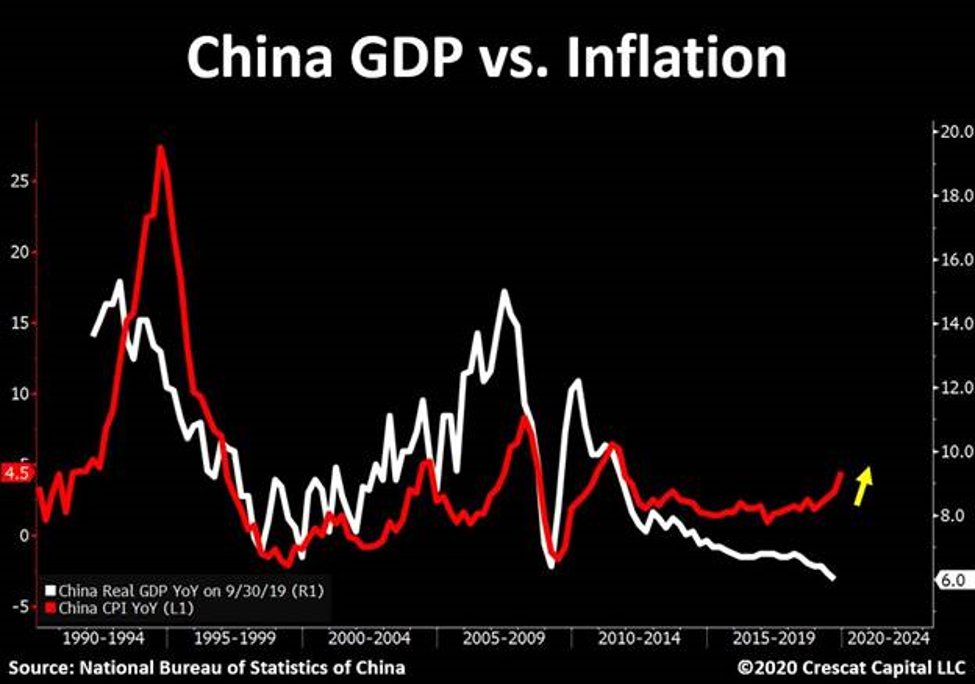
The end game for China’s currency becomes even more evident when the country’s domestic inflation heads higher while its GDP heads south. That has already begun as we show in the chart below. With China’s extraordinary debt, we think its rising domestic inflation is one of many signs that a currency crisis is near.
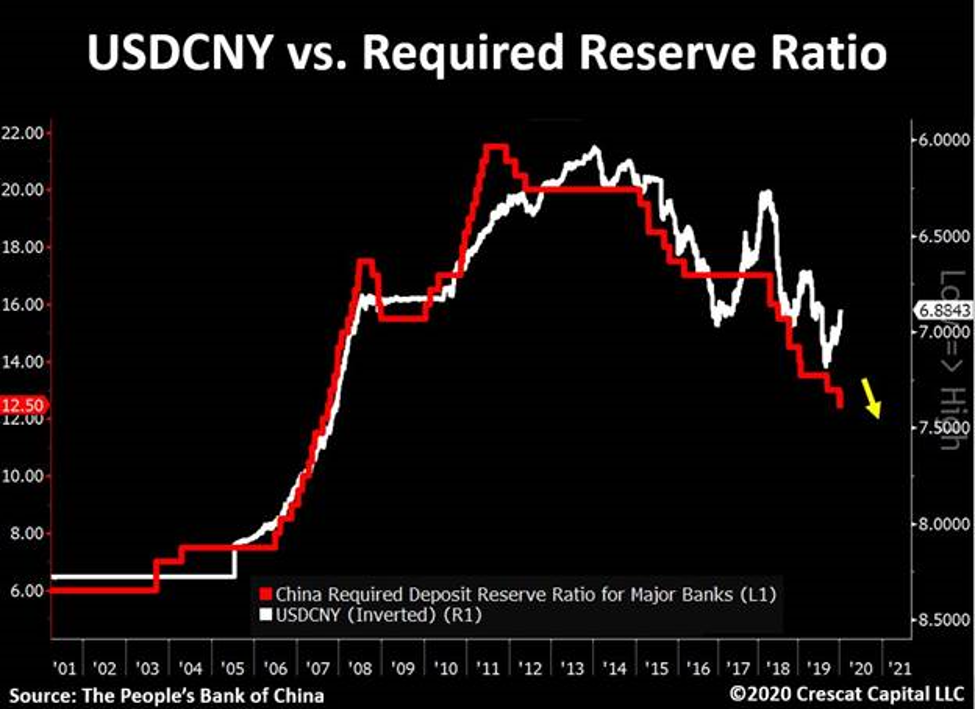
China pulled all the stops to keep its currency strong ahead of the US phase 1 trade deal. Its recent emergency reserve ratio cuts, however, underscore the true downward pressure on its exchange rate. Coronavirus could be the convenient excuse for China to declare force majeure on upholding its trade deal pledge to not competitively devalue its currency. In our analysis, China is poised to soon lose control of its currency. But it will be a lot more than a competitive devaluation. It will be a full-blown, currency crisis.
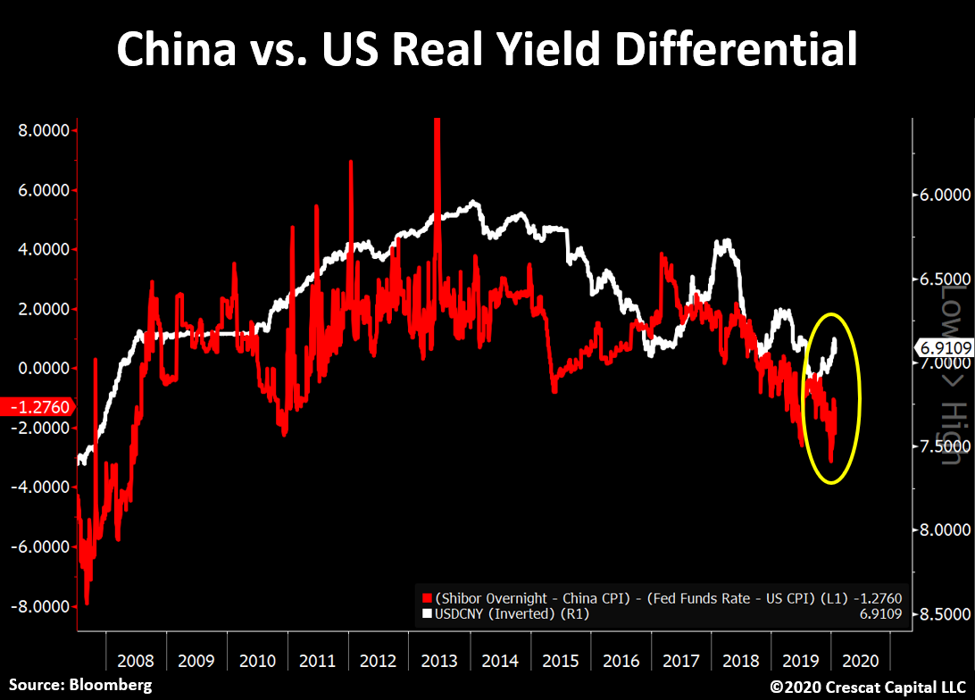
Real yields in China are already plunging relative to real yields in the US. This is yet another set up for an impending yuan decline.
Big Opportunity on the Uncrowded Short Side
Outside of precious metals and just a few other stocks in a few other industries, we are convinced that the best way to make money in US stocks between now and the coming recession is to short them. While following our models and risk controls, we are determined to be successful doing that in our hedge funds.
As we mentioned at the beginning of this letter, the stock market may have just likely peaked on extreme bullish sentiment and overbought conditions. The vertical white bars in the chart below that show three factors that measure these overbought conditions: % of stocks above their 200-day moving average, the CBOE Put Call Ratio, and the VIX Volatility Index. The technical indicators reached an extreme on January 17 just as the Coronavirus started to spread. Similar extremes in these technical measures over the past two years during this late-cycle regime have marked significant short-term tops. Could this finally be the big one?
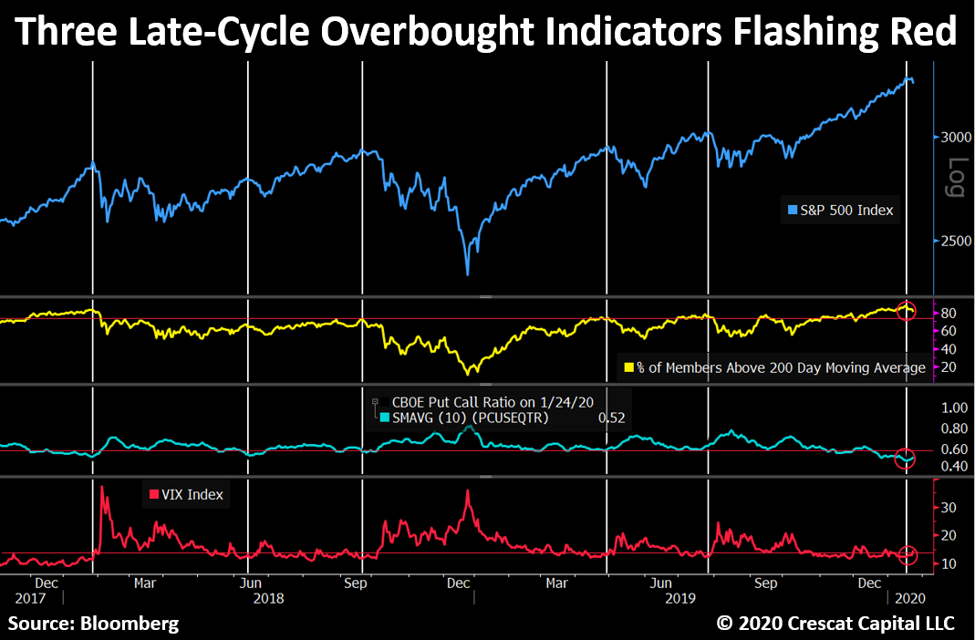
Most importantly, each of these prior white bars corresponded a time when Crescat’s hedge funds had endured a significant pullback right ahead of them based on our strong tactical net short bias. Such was also the case coming into January 17. The encouraging news is that each of those prior white bars immediately preceded months where Crescat’s hedge funds then went on to generate substantial run-ups: Feb 2018; June 2018; Oct-Dec 2018; May 2019; and Aug 2019 while the rest of the market faltered. We show this in the chart below. Note the timing versus each of the white bars above. We believe a similar opportunity lies ahead in the short run. Our hedge funds are up from their lows reached on January 17, but the correction in the market at large appears only to have just begun. The market is still near its all-time high.
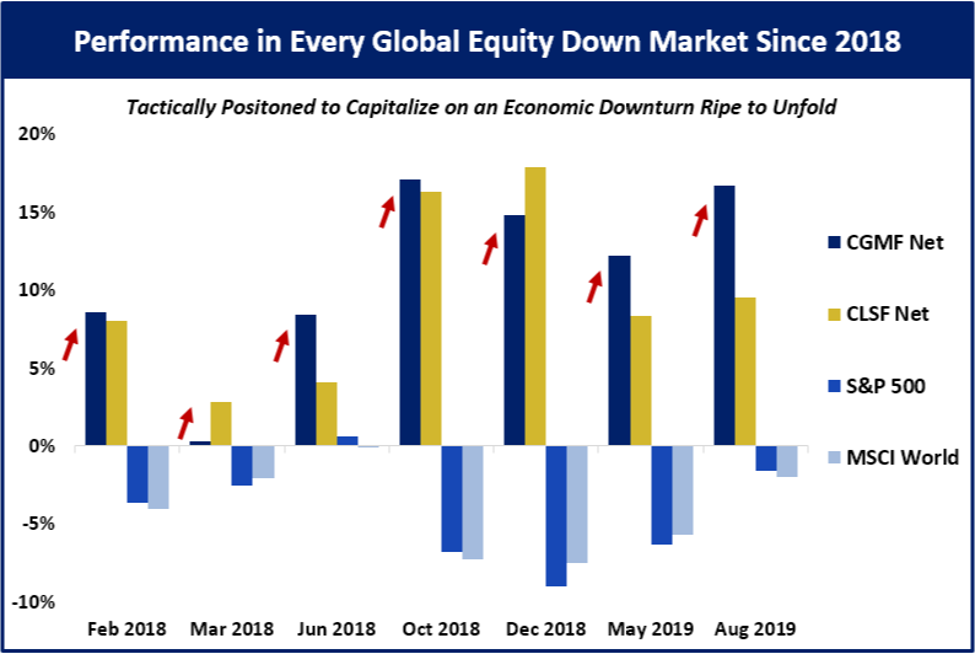
We believe Crescat’s hedge funds can help tremendously as a slice of one’s overall allocation to avoid the pitfalls of the typical long-only (60/40) stock and bond portfolio. Crescat’s hedge funds have performed strongly in all down months of the global equity markets over the last two years. We are not perma-bears, but we are determined to capitalize on a downturn in the business cycle that we began positioning for in late 2017 based on our macro model. It hasn’t happened yet. The market is still near record price and valuation highs, but our models continue to strengthen our conviction. We believe a bear market and recession in the near term are highly probable.
We believe October and December of 2018, as well as May and August of 2019 in chart above are just glimpses of what our hedge funds can generate when the business cycle turn down for real. There are very few funds in the world today positioned capitalize on this opportunity. We believe that we are one of them. We haven’t seen anything yet in terms of the market downturn we are expecting.
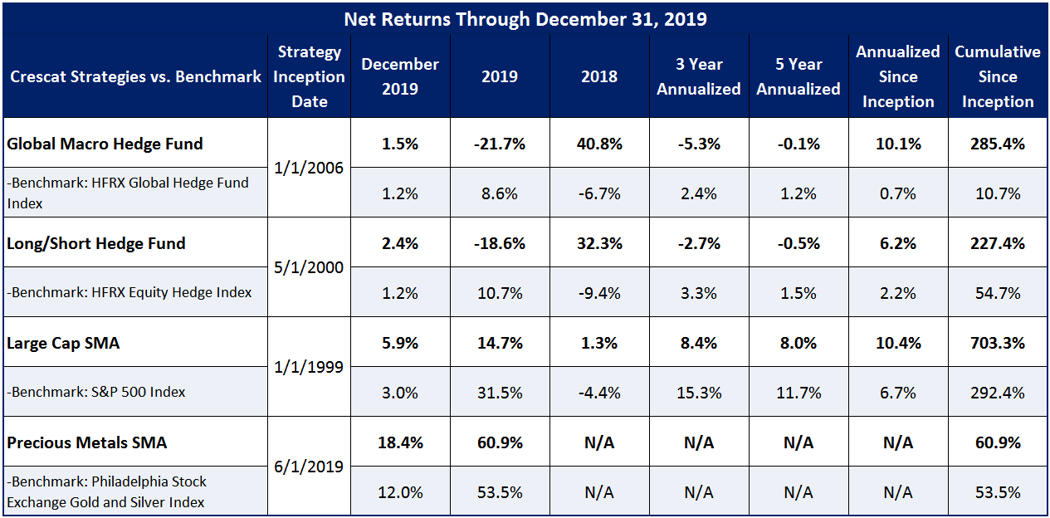
We would also like to bring your attention to our recently launched long-only precious metals SMA that was up 60.9% net in its first seven months to finish 2019. We carved out the long-only gold and silver stocks from our hedge funds to make this strategy available as a separate account for those whose goal is to capitalize on the current macro environment in a long-only vehicle in our most high-conviction long asset class.
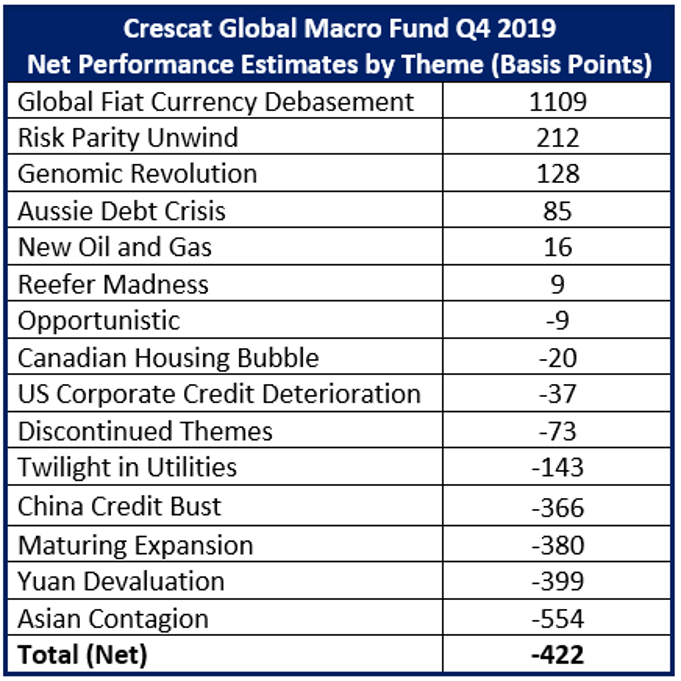
Q4 2019 Profit Attribution for Crescat Global Macro Fund
Crescat Performance Across All Strategies
Sincerely,
Kevin C. Smith, CFA
Chief Investment Officer
Tavi Costa
Portfolio Manager