It started in mid-February for jet fuel and in mid-March for gasoline.
By Wolf Richter for WOLF STREET.
Oil companies are reporting financial fiascos every day: Today Exxon reported its first quarterly loss since 1999 ($610 million), on a “market-related” $2.9 billion write-down. “We’ve never seen anything like what the world is facing today,” CEO Darren Woods said.
On Thursday, Texas-based shale-driller Concho Resources reported a quarterly loss of $9.3 billion, after writing down the value of its oil and gas assets by $12.6 billion.
Also on Thursday, it was reported that Oklahoma-based Chesapeake Energy, a pioneer in shale-drilling, was preparing to file for bankruptcy (what’s taking so long?).
Still on Thursday, Royal Dutch Shell shocked the markets when it announced that it would reduce its dividend for the first time since 1945 (by 66% from $0.47 to $0.16). “The duration of these impacts remains unclear with the expectation that the weaker conditions will likely extend beyond 2020,” the statement said. The already beaten-up shares plunged another 17% in two days. Shares are down 47% year to date.
Earlier in April, among the oil companies that have already filed for bankruptcy, were two high-profile oil drillers, Whiting Petroleum and Diamond Offshore Drilling.
The drama is centered on the collapse in demand for crude oil. Crude oil is primarily used for two purposes: transportation fuel and as feedstock for the chemical industry. Even before the crisis, demand growth has been weak, particularly as transportation fuel in developed countries. But production has been surging, and amid ample and growing supply, prices were already weak, when the coronavirus hit.
Demand for transportation fuel in the US collapsed.
For gasoline, it started in mid-March when the measures to tamp down on the spread of the coronavirus took effect. For jet fuel, it started in mid-February as flight cancellation from the US to China, and then to other countries took effect. We can see this in the weekly data provided by the EIA.
The EIA measures weekly consumption in terms of product supplied, such as by refineries and blenders, not by retail sales.
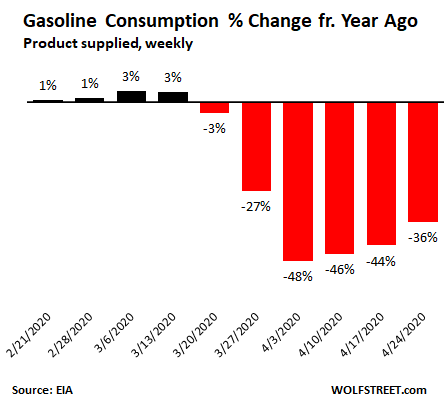
Consumption of motor gasoline was still up 3.1% in the week ended March 13, compared to the same week last year, according to EIA data. But then demand just collapsed. In the week ended April 3, gasoline demand was down 48% compared to the same week a year earlier:

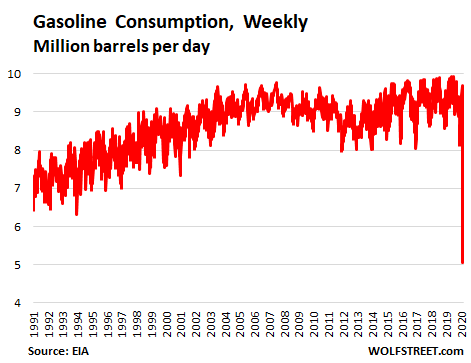
In terms of barrels per day (b/d), demand for motor gasoline was well above 9 million b/d in the four weeks up to mid-March, but then demand collapsed, down to 5.07 million b/d in the week ended April 3. Then demand ticked up. By the week ended April 24, demand was 5.86 million b/d. Those last four weeks were by far the lowest on record in the EIA’s data going back to 1991:
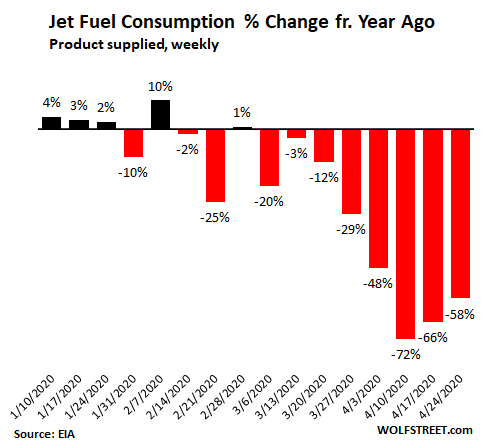
Consumption of jet fuel (kerosene type) collapsed even more, peaking, if you will, in the week ended April 10 with a 72% year-over-year plunge. The decline in jet fuel demand started earlier than with gasoline, as flight cancellations were starting in the second half of February:
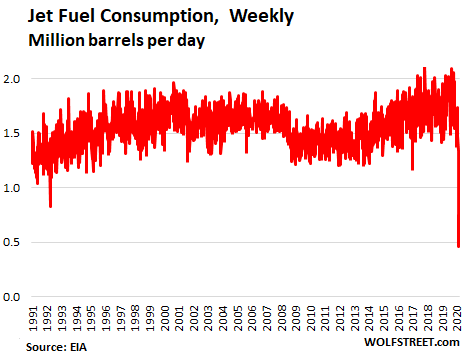
In terms of barrels per day, demand for jet fuel collapsed to just 463,000 b/d in the week ended April 10. The last four weeks – ranging from 463,000 b/d to 800,000 b/d – were by far the lowest in the data going back to 1991:
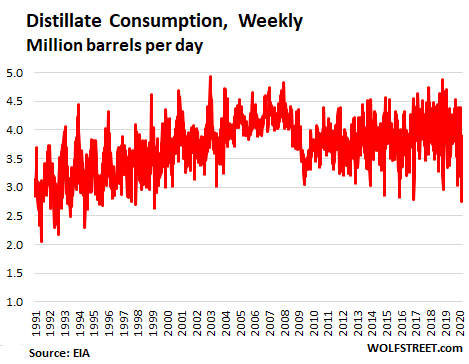
Consumption of distillate is highly variable because of its uses. It includes diesel fuels and fuel oils, such as for space heating and power generation, which are seasonal. So this is not as clear cut.
Distillate consumption plunged between 18% and 25% in the last three weeks, compared to the same weeks a year ago. But consumption of fuel oil for heating and power-generation is so seasonal and so volatile that these moves are not totally unusual. However, consumption in the week ended April 10 plunged to 2.76 million barrels per day, the lowest weekly demand since 1999:
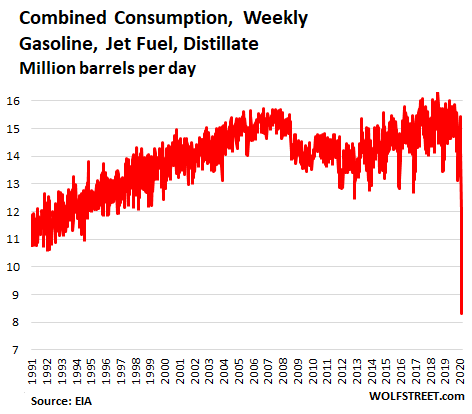
Combined, gasoline, jet fuel, and distillate consumption, plunged by 22% to 43% over the last four weeks. In terms of barrel per day, the combined consumption collapsed to a low of 8.3 million b/d in the week ended April 10 and has ticked up since then. The last four weeks, ranging from 8.3 million b/d to 9.8 million b/d, were by far the lowest in the data going back to 1991:
In terms of transportation fuels, this is what the oil industry is facing: an unprecedented, and until now unimaginable collapse in demand that has persisted for over four weeks. While it may improve ever so gradually as we move forward, it will remain at multi-decade low levels until the US economy’s travel and commuting patterns, and its shipping patterns find their way to whatever the new normal might look like.
Oil companies are faced with the double whammy of the collapse in demand in terms of volume, where they sell much less product; and the collapse in prices, where they get fewer dollars for the product they do sell.