Wolf Richter wolfstreet.com, http://www.amazon.com/author/wolfrichter
The underlying dynamics changed in August and have worsened since. And this is still the tech boom.
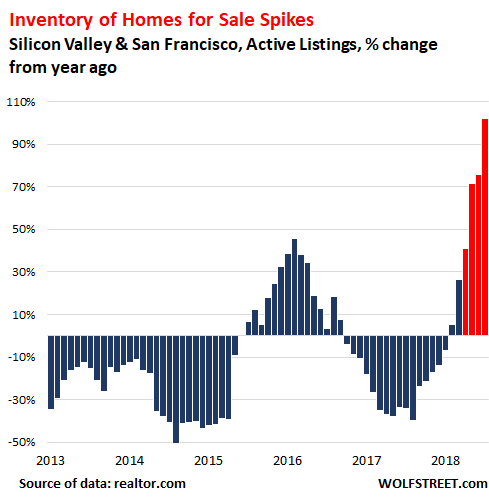
It’s high time to unload houses and condos in Silicon Valley and San Francisco, one of the most expensive housing markets in the US. Sellers are now flooding the market with properties. Inventory listed for sale in those three counties that make up the area – San Francisco, San Mateo, and Santa Clara – surged by 102% in November compared to November last year, to 3,931 listings.
In each of the past three months, the number of active listings (new listings plus old listings that have not sold yet but haven’t been pulled from the market) was the highest since August 2014. The chart below shows the year-over-year percentage change in active listings. The red bars in the chart mark the beginning of bubble trouble in this housing market (all data via the National Association of Realtors at realtor.com):
When inventories are piling up because sales are slowing, sellers have to figure out where the market is, and the market is where the buyers are, but buyers have become listless and refuse to participate in bidding wars. They see the prices and they do the math with higher mortgage rates, and they walk. So, motivated sellers have to do something to move the properties. And they started cutting prices.
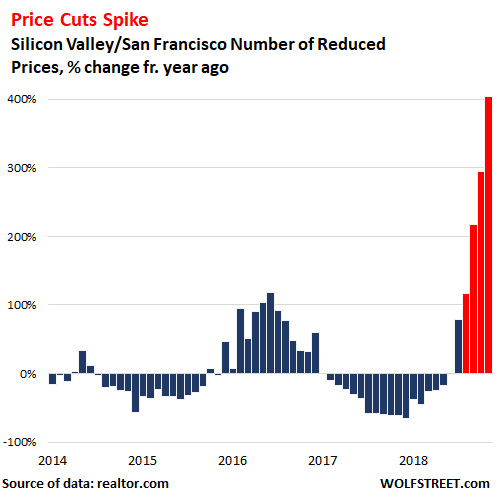
In November, the number of properties on the market with price cuts, at 1,038, skyrocketed by over 400% year over year.
The chart of the year-over-year percentage changes in price cuts in Silicon Valley and San Francisco shows that the change of direction in the market occurred around August. By September, price cuts hit the highest level since Housing Bust 1:
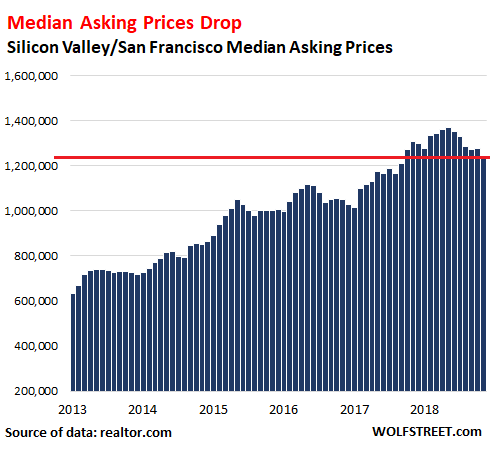
The median asking price for the three counties had peaked in May at $1,369,200 and has since fallen by $132,100 or by nearly 10% from the peak, to 1,237,100. Median asking price means half are listed for more and half are listed for less. It differs from the median selling price at which homes are actually sold. Compared to November last year, the median asking price dropped by $71,200 or 5.4%:
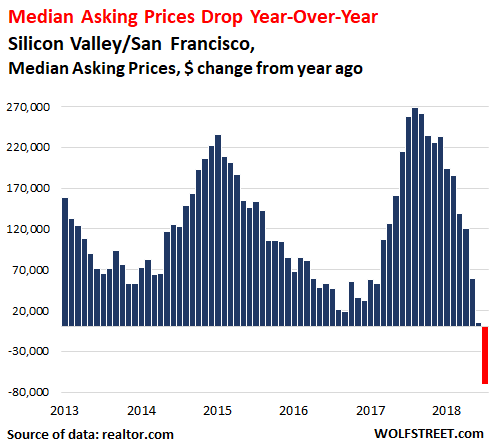
The chart below shows the percentage change of median asking prices, which clarifies further the underlying dynamics in the market:
After years of blaming the surging home prices in the area on a shortage of inventory for sale, the industry is suddenly faced with all kinds of inventory coming out of the woodwork, just as sales are slowing and as mortgage rates are rising, while the affordability crisis bites the market.
Buyers have lost their blind enthusiasm. They’re still buying, but at lower prices, and they’re taking their time.
Yet the hiring slowdowns – or worse, layoffs – at area tech companies and the broad wind-down of countless and hopelessly cash-burning start-ups – both a prominent feature of every tech downturn here – haven’t even started yet. The area is still booming and companies are still hiring, and this housing downturn is starting during the tech boom, and not as a consequence of a tech meltdown. Though share prices of local companies such as Google, Apple, Facebook, and many others have taken a big hit since the summer, we’re still far from a classic tech meltdown. That is yet to come.
The Case-Shiller home price index lags by about three months, but it too is now picking up the changes in the market: Seattle home prices dropped at fastest pace since Housing Bust 1, while the first price declines cropped in San Francisco, Denver, Portland, and other markets. Read… The Most Splendid Housing Bubbles in America Deflate