What a difference just a couple of months can make.
Since the financial crisis, there has been much commentary written about the low forward returns on stocks over the subsequent 10-year period from high valuation levels. The chart below shows the forward 10-year returns from previously valuation levels.
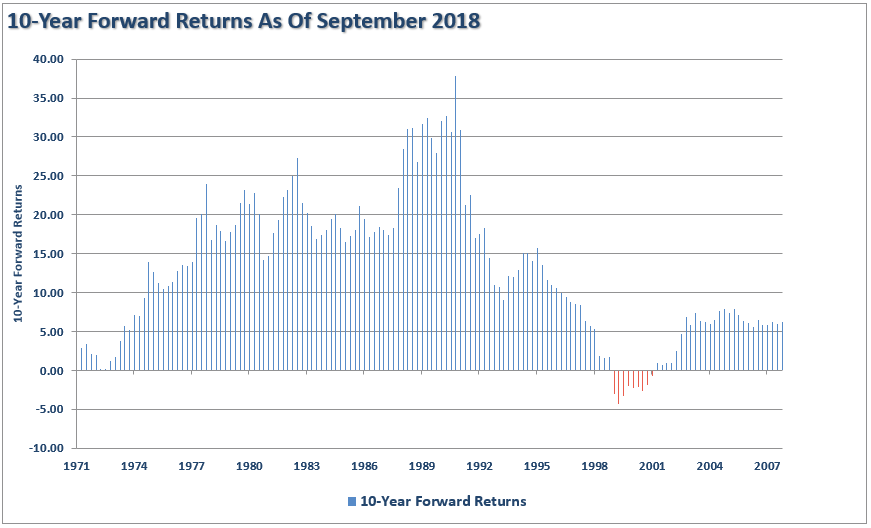
However, just a couple of months later, those forward returns have exploded higher.
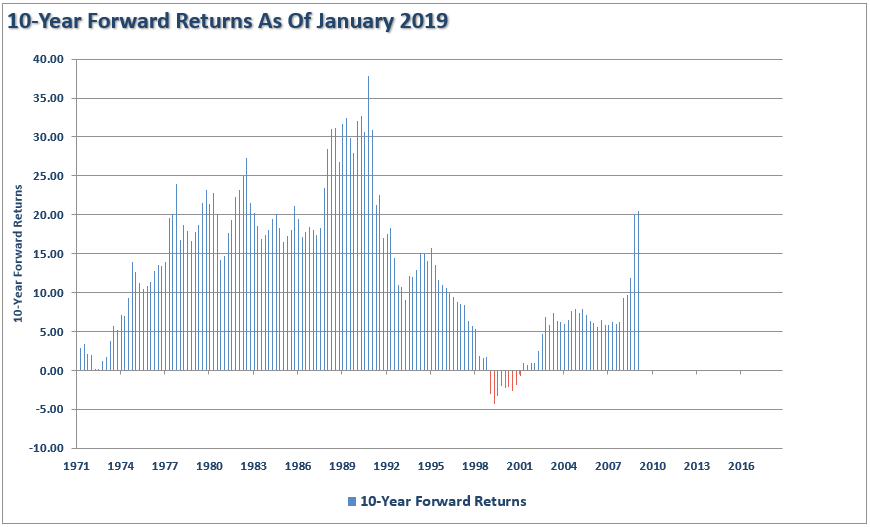
What changed?
Nothing really. It is simply the function to the massive decline in 2008 being removed from the 10-year average.
However, while the forward returns have spiked in recent months, this has been due to a market that has been fueled higher by massive amounts of global monetary stimulus rather than a reversion in valuations that fostered an organic growth in returns.
Just recently, Brian Livingston, via MarketWatch, wrote an article on the subject of valuation measures and forward returns.
“Stephen Jones, a financial and economic analyst who works in New York City, tracks the formulas that several market wizards have disclosed. He recently updated his numbers through Dec. 31, 2018, and shared them with me. Buffett, Shiller, and the other boldface names had nothing to do with Jones’s calculations. He crunched the financial celebrities’ formulas himself, based on their public statements.”
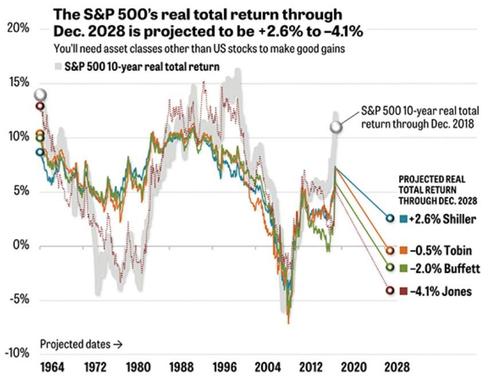
“The graph above doesn’t show the S&P 500’s price levels. Instead, it reveals how well the projection methods estimated the market’s 10-year rate of return in the past. The round markers on the right are the forecasts for the 10 years that lie ahead of us. All of the numbers for the S&P 500 include dividends but exclude the consumer-price index’s inflationary effect on stock prices.”
- Shiller’s P/E10 predicts a +2.6% annualized real total return.
- Buffett’s MV/GDP says -2.0%.
- Tobin’s “q” ratio indicates -0.5%.
- Jones’s Composite says -4.1%.
(Jones uses Buffett’s formula but adjusts for demographic changes.)
Here is the important point:
“The predictions might seem far apart, but they aren’t. The forecasts are all much lower than the S&P 500’s annualized real total return of about 6% from 1964 through 2018.”
While these are not guarantees, and should never be used to try and “time the market,” they are historically strong predictors of future returns.
As Jones notes:
“The market’s return over the past 10 years,” Jones explains, “has outperformed all major forecasts from 10 years prior by more than any other 10-year period.”
Of course, as noted above, this is due to the unprecedented stimulation that the Federal Reserve pumped into the economy.
However, markets have a strong tendency to revert to their average performance over time, which is not nearly as much fun as it sounds.
But Jones isn’t the only one who has warned about the risks of high-valuations. The late Jack Bogle, founder of Vanguard stated:
“The valuations of stocks are, by my standards, rather high, but my standards, however, are high.
When considering stock valuations, Bogle’s method differs from Wall Street’s. For his price-to-earnings multiple, Bogle uses the past 12 months of reported earnings by corporations, GAAP earnings, which include ‘all of the bad stuff,’ to get a multiple of about 25 or 26 times earnings.
‘Wall Street will have none of that. They look ahead to the earnings for the next 12 months and we don’t really know what they are so it’s a little gamble.’
He also noted that Wall Street analysts look at operating earnings, ‘earnings without all that bad stuff,’ and come up with a price-to-earnings multiple of something in the range of 17 or 18.
‘If you believe the way we look at it, much more realistically I think, the P/E is relatively high,’
‘I believe strongly that [investors] should be realizing valuations are fairly full, and if they are nervous they could easily sell off a portion of their stocks.’”
This, of course, from the father of “buy and hold” investing with whom millions of Americans have pumped roughly $4.7 Trillion into a whole smörgåsbord of indexed based ETF’s provided by Vanguard to meet investor appetites.

Richard Thaler, the famous University of Chicago professor who won the Nobel Prize in economics also stated:
“We seem to be living in the riskiest moment of our lives, and yet the stock market seems to be napping. I admit to not understanding it.
I don’t know about you, but I’m nervous, and it seems like when investors are nervous, they’re prone to being spooked. Nothing seems to spook the market.”
As noted, the flood of liquidity, and accommodative actions, from global Central Banks, has lulled investors into a state of complacency rarely seen historically. However, while market analysts continue to come up with a variety of rationalizations to justify high valuations, none of them hold up under real scrutiny. The problem is the Central Bank interventions boost asset prices in the short-term, in the long-term, there is an inherently negative impact on economic growth. As such, it leads to the repetitive cycle of monetary policy.
- Using monetary policy to drag forward future consumption leaves a larger void in the future that must be continually refilled.
- Monetary policy does not create self-sustaining economic growth and therefore requires ever larger amounts of monetary policy to maintain the same level of activity.
- The filling of the “gap” between fundamentals and reality leads to consumer contraction and ultimately a recession as economic activity recedes.
- Job losses rise, wealth effect diminishes and real wealth is destroyed.
- Middle class shrinks further.
- Central banks act to provide more liquidity to offset recessionary drag and restart economic growth by dragging forward future consumption.
- Wash, Rinse, Repeat.
If you don’t believe me, here is the evidence.
The stock market has returned more than 80% since 2007 peak, which is more than two-times the growth in corporate sales and three-times more than GDP.
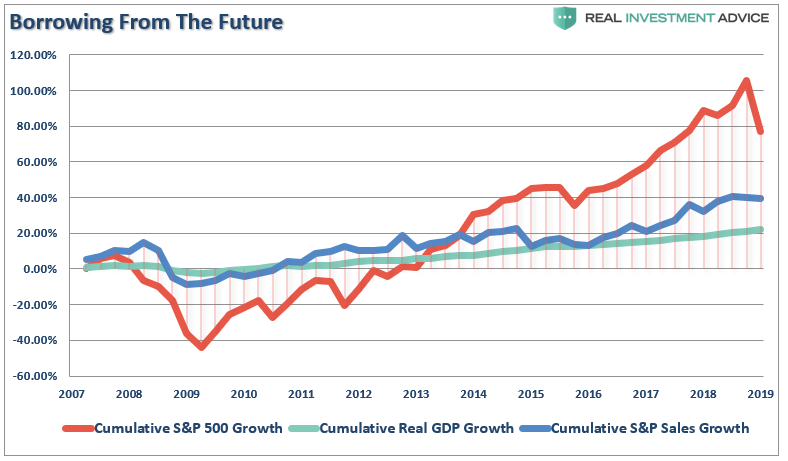
It is critical to remember the stock market is NOT the economy. The stock market should be reflective of underlying economic growth which drives actual revenue growth. Furthermore, GDP growth and stock returns are not highly correlated. In fact, some analysis suggests that they are negatively correlated and perhaps fairly strongly so (-0.40).
However, in the meantime, the promise of a continued bull market is very enticing as the “fear of missing out”overrides the “fear of loss.”
Valuations Are Expensive
This brings us back to Jack Bogle and the importance of valuations which are often dismissed in the short-term because there is not an immediate impact on price returns. Valuations, by their very nature, are HORRIBLE predictors of 12-month returns should not be used in any strategy that has such a focus. However, in the longer term, valuations are strong predictors of expected returns.
I have adjusted Bogle’s measure of valuations to a 24-month, versus 12-month, measure to smooth out the enormous spike in valuations due to the earnings collapse in 2008. The end valuation result is the same but peaks, and troughs, in valuations are more clearly shown.
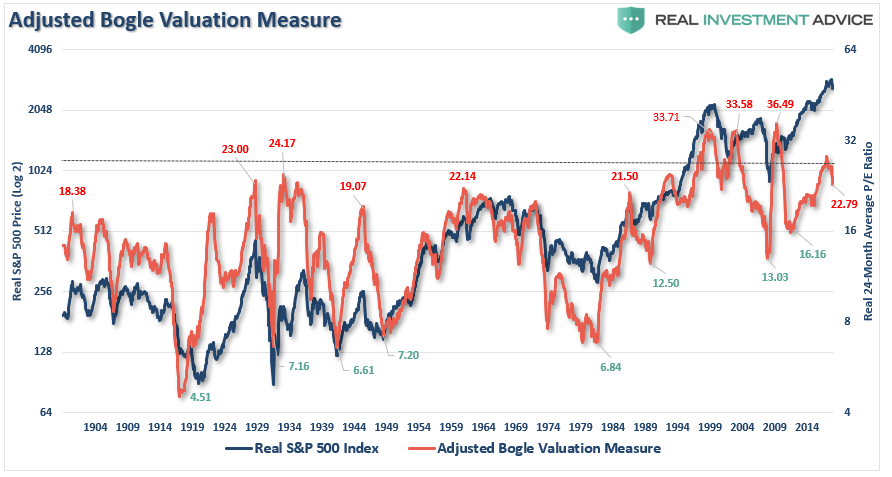
While the current 2-year average P/E is at 23x earnings, it was over 26x just a couple of months ago. The decline has been due to a drop in the “P” but the “E” is about to drop as well which will keep valuations elevated. Nevertheless, Bogle is correct that valuations have reached expensive levels. More importantly, outside of the peak in 1999, stocks are as highly valued today than at previous market peaks in history.
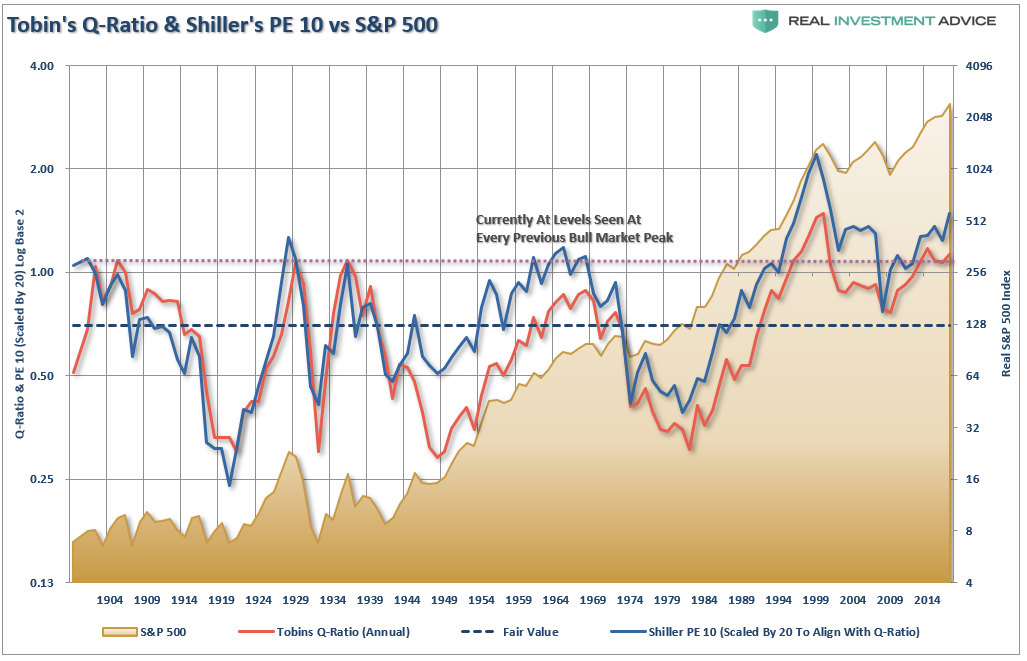
Bogle’s view is also confirmed by other measures as well. The chart below shows Dr. Robert Shiller’s cyclically adjusted P/E ratio combined with Tobin’s Q-ratio. Again, valuations only appear cheap when compared to the peak in 2000. Outside of that exception, the financial markets remain expensive.
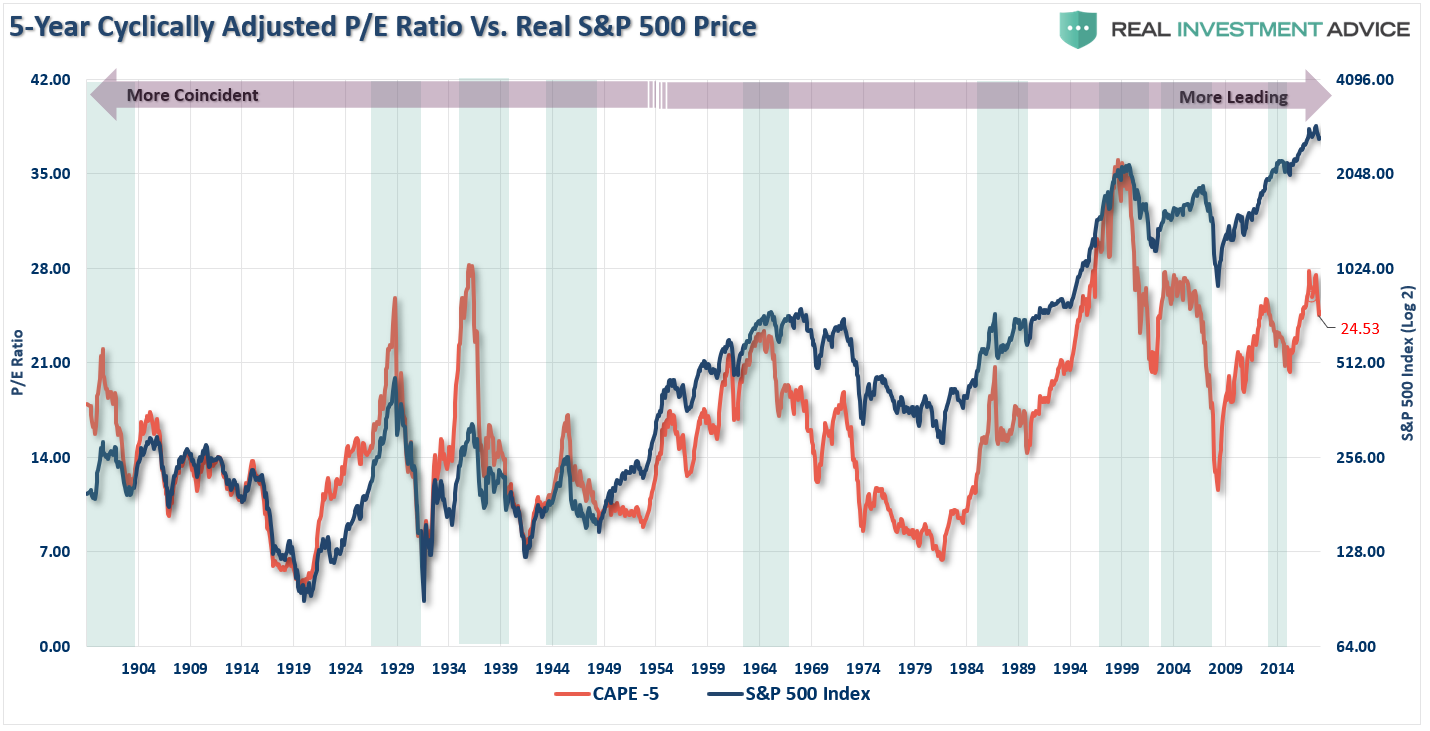
I have also previously modified Shiller’s CAPE to make it more sensitive to current market dynamics.
“The need to smooth earnings volatility is necessary to get a better understanding of what the underlying trend of valuations actually is. For investor’s, periods of ‘valuation expansion’ are where the bulk of the gains in the financial markets have been made over the last 116 years. History shows, that during periods of ‘valuation compression’ returns are more muted and volatile.
Therefore, in order to compensate for the potential ‘duration mismatch’ of a faster moving market environment, I recalculated the CAPE ratio using a 5-year average as shown in the chart below.”
To get a better understanding of where valuations are currently relative to past history, we can look at the deviation between current valuation levels and the long-term average going back to 1900.
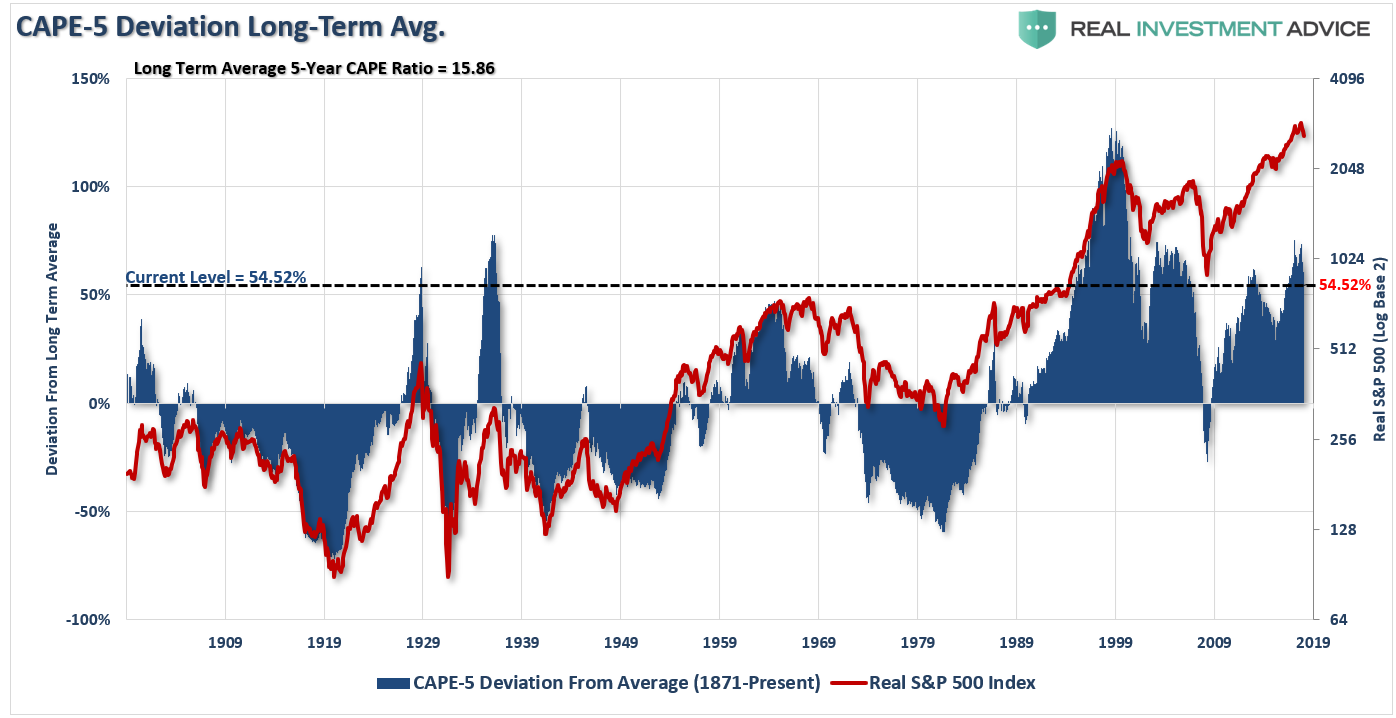
With a 54.52% deviation from the long-term mean, a reversion will be quite damaging to investors when it occurs.As you will notice, reversions have NEVER resulted in a “sideways” consolidation but rather more serious declines. These rapid “maulings” of investors is why declines are aptly named “bear markets.”
Lastly, even Warren Buffett’s favorite valuation measure is screaming valuation issues. The following measure is the price of the Wilshire 5000 market capitalization level divided by GDP. Again, as noted above, asset prices should be reflective of underlying economic growth rather than the “irrational exuberance” of investors.
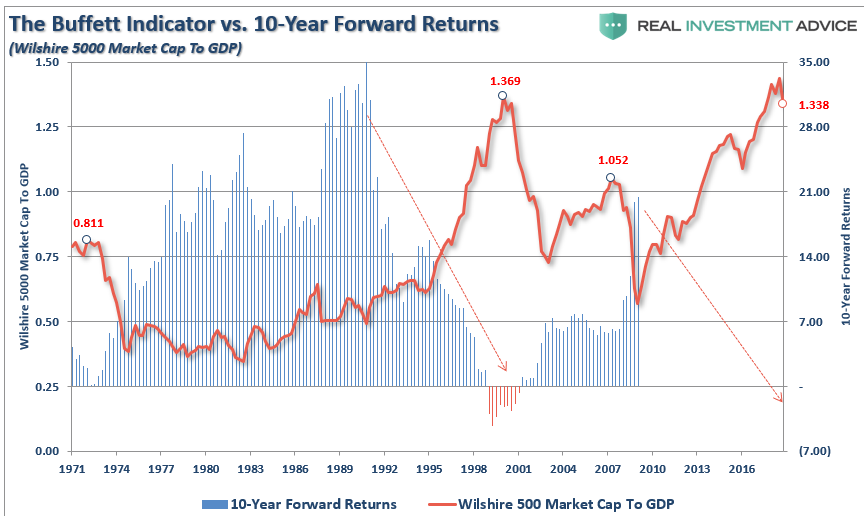
Note that 10-year forward earnings peak at the trough of the previous bear market. Like today, forward earnings are peaking due to the removal of the 2008 financial crisis. From this point forward, forward returns will begin to fall sharply.
Maybe Not Today
Jones, Bogle, Buffett, Shiller, and Tobin are right about valuations.
Maybe not today.
Next month.
Or even next year.
But as Vitaliy Katsenelson previously penned:
“Our goal is to win a war, and to do that we may need to lose a few battles in the interim.
Yes, we want to make money, but it is even more important not to lose it. If the market continues to mount even higher, we will likely lag behind. The stocks we own will become fully valued, and we’ll sell them. If our cash balances continue to rise, then they will. We are not going to sacrifice our standards and thus let our portfolio be a byproduct of forced or irrational decisions.
We are willing to lose a few battles, but those losses will be necessary to win the war. Timing the market is an impossible endeavor. We don’t know anyone who has done it successfully on a consistent and repeated basis. In the short run, stock market movements are completely random – as random as you’re trying to guess the next card at the blackjack table.”
With that point, I clearly agree.
But, if you can’t use these predictions to time the market, what good are they? As Brian concluded in his article:
“For long-term investors, the likelihood that the market is overpriced and will eventually pull back to a lower valuation should flash a bright yellow “caution” light. A disappointing decade is not the time to gamble your money on a 100% stock portfolio. Diversifying into other types of assets can prevent any one index – such as the S&P 500 – from dragging down your performance.
“You are the captain of your own destiny, but you don’t have to go down with the ship when the S&P 500 hits the inevitable rocks. Diversify now.”