Any large decline in stocks often brings up the question, should one start buying the dips or selling rallies.
The decline of late and the bounce higher the past few days most likely have millions of investors around the world pondering this very question.
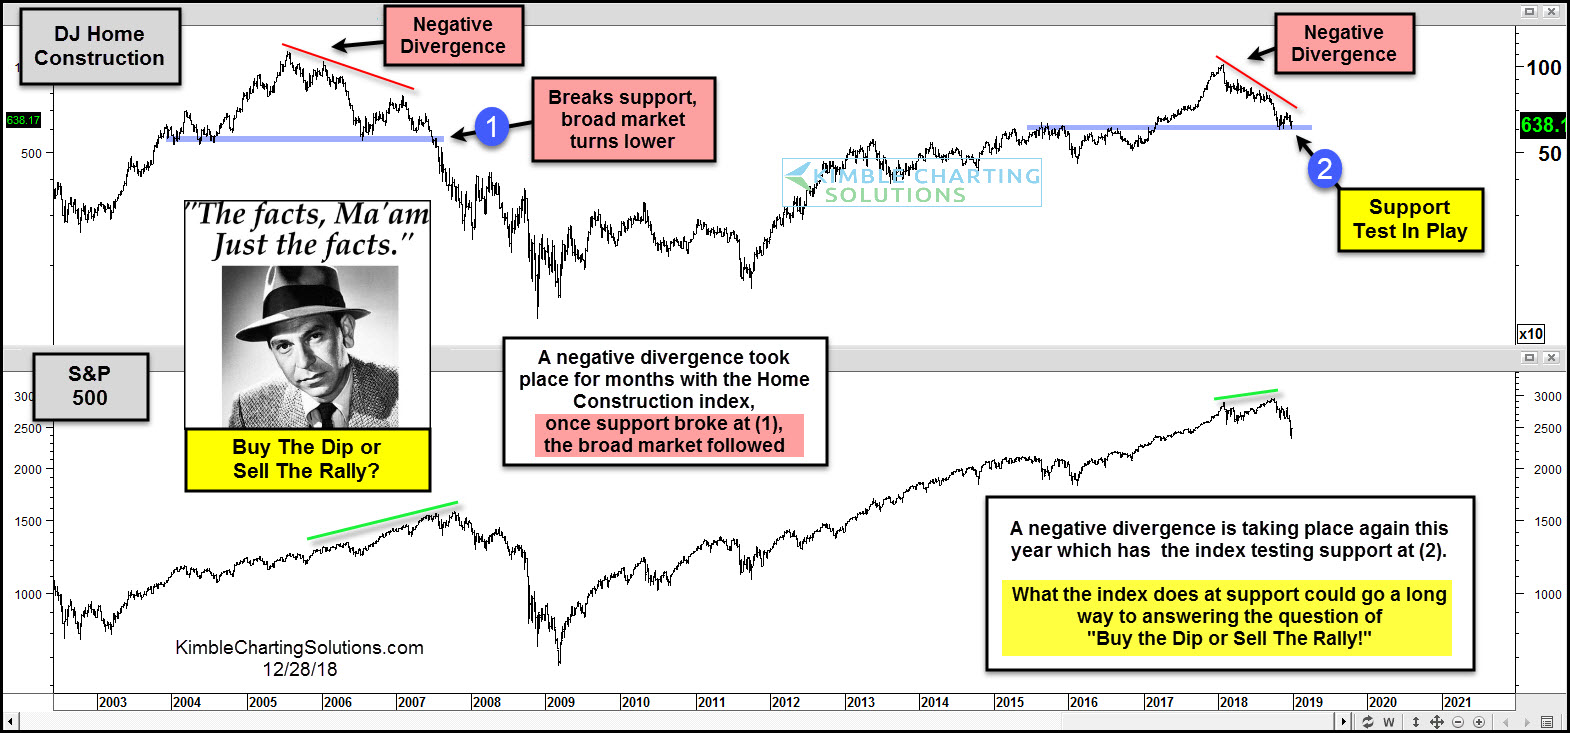
This chart overlays the Dow Jones Home Construction index and the S&P 500 over the past 15-years. In 2006, the Home Construction index experienced a negative divergence for months with the S&P 500. Once Home construction broke multi-year support at (1), both fell very hard. The strategy that paid off after the support break; sell the rallies.
The Home Construction index this year has been experiencing a negative divergence again with the S&P 500. The large decline now has the Home Construction index testing multi-year support at (2).
Joe Friday Just The Facts Ma’am- What the DJ Home Construction index does at this support test, should go a long way to answering if one should buy the dip or sell the rally going forward.
Keep a close eye on this index friends, it could send a very important message of what is the best strategy for stocks in the New Year!