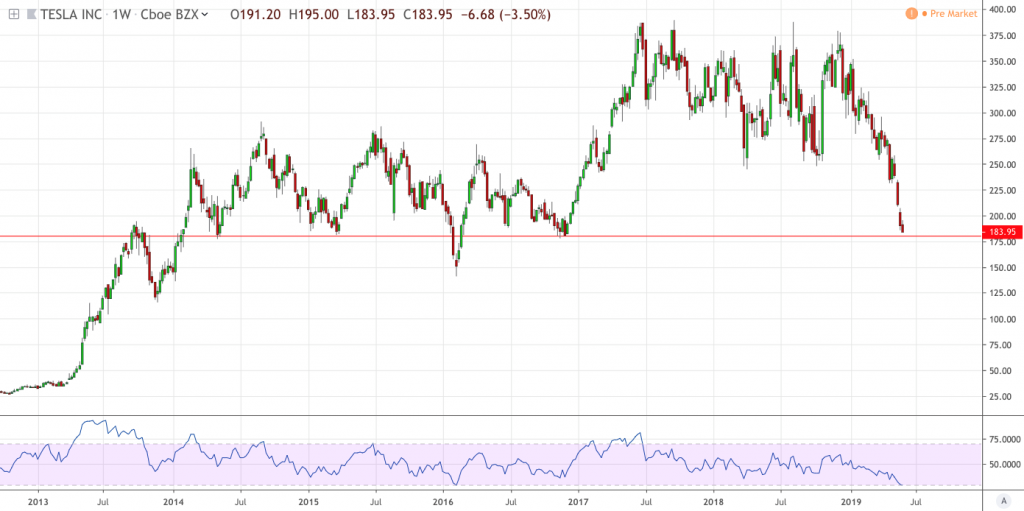
Tesla bulls and Elon Musk fans everywhere are hoping that the decline in Tesla stock price will end soon. After the stock breached the technically important $250 price level, the next key support level is in the $180 range, close to where the stock is trading now.
Tesla has emotionally attached both bullish and bearish investors. Spend ten minutes on financial Twitter and the emotions from those thinking Tesla is going to zero to those thinking the right price in the 1,000’s is easily evident. Bulls certainly want Tesla to hold the $180 line, but as Toto sang in the 1970s, “Love isn’t always on time.”
On a weekly chart, we can see that the $180 price level has served as important support and resistance since 2013. More evidence supporting the Tesla is oversold, is that weekly RSI is as over-sold as the most recent dip below $180 in early 2016.
A linear regression of the recent TSLA downtrend on a daily chart shows price currently extended at the bottom of the range. This linear regression has a high confidence factor over 92%.

The TSLA Options Market
The options market provides institutions and other large position holders an ability to hedge their TSLA exposure, whether the funds are invested long or short. Since TSLA has a history of being difficult or expensive to short, liquidity is abundant in TSLA options. I imagine that there are many retail and institutional investors who short TSLA by buying puts.
The market makers who facilitate this trade almost always hedge their exposure instantaneously and dynamically with delta-neutral portfolios. The market makers perform combination trades to (theoretically) hedge their exposure to price while also profiting from options volatility. The maximum profit for the market makers will occur if the price of the stock settles near the price level where their individual portfolio is delta neutral. As a result, it can be enlightening to track neutral delta levels for Tesla as we do for many different stocks, ETFs and commodities.
TSLA Op-ex Sweet Spot
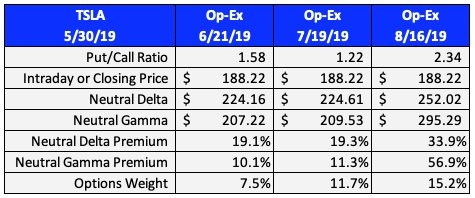
I consider the price range between Neutral Delta and Neutral Gamma to be the “sweet spot” for stock prices on or before option expiration. On May 29th, TSLA had a sweet spot in the $207 to $225 range for the June 21st op-ex. As such, our indicator currently considers TSLA to be over-sold near $180/share.
Source: Viking Analytics
Additional Comments
- Put-call ratios in the 1.2 to 2.4 range suggest that there is potential support for TSLA in the event of a sharp decline in price. TSLA’s put-call ratios have fallen somewhat over the past week, however.
- At the closing price of $188 on May 30th, the total value of at-the-money puts in TSLA stock was $1.25 Billion greater than the total value of at-the-money calls for the next three option expirations.
- The basic theory behind the Neutral Delta and Neutral Gamma levels can be found by reading a quick introduction on this link: Introduction to Options Sentiment.
Price and Neutral Delta Converge
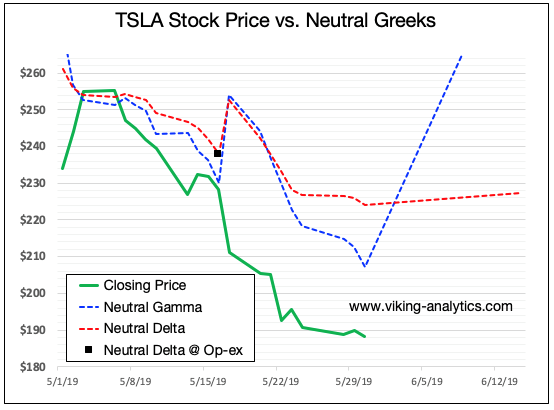
Due to order flow, contract rollover and hedge dynamics, there tends to be a convergence between stock prices and the point of delta neutral as option expiration comes nearer. Here is TSLA stock price versus Neutral Delta and Neutral Gamma for the month of May 2019 into the June option expiration.
Gamma is a Wild Card
Extreme divergences between Neutral Gamma and price can also point towards forced-buying or forced-selling events. I have outlined this dynamic in several articles, including: Negative Gamma and the Demise of Optionsellers.com. Neutral Gamma is currently trending with price, which is common. However, our data shows that Neutral Gamma may begin to spike as option expiration comes nearer. This highlights the potential for forced selling by the put sellers as option expiration comes nearer.
Final Thoughts
Tesla is over-sold on several metrics. The weekly RSI is at a multi-year low, and price is currently at the bottom of an orderly downtrend channel. The options market has priced in a modest recovery into June option expiration; however, there is potential for a forced selling event if too many puts remain in the money. I will consider a long trade in TSLA in early to mid-June if it successfully tests the $180 price level and the forced selling potential dissipates.
Disclaimer
This is for informational purposes only and is not trading advice.