Wolf Richter wolfstreet.com, http://www.amazon.com/author/wolfrichter
House prices in Toronto still below 2017 peak. Montreal, Ottawa hit new highs. Quebec City about flat with Jun 2013. Edmonton back to Oct 2007. Calgary rises to March 2014 level.
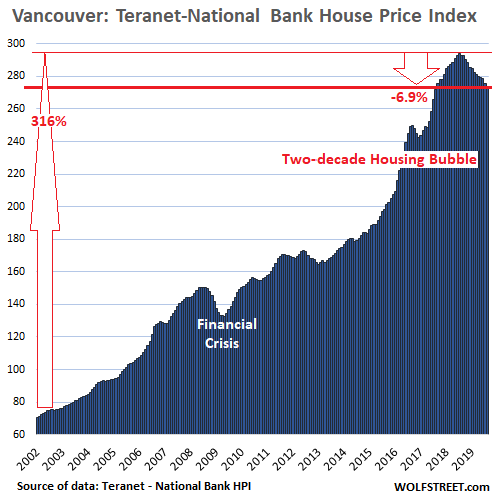
House prices in Canada, as tracked by the Teranet-National Bank National House Price Index, have more than tripled (+204%) since January 2002. But in August, they ticked up only 0.6% from August last year, the weakest year-over-year increase since October 2009. The biggest drag was the market in Vancouver, which is relentlessly spiraling down.
Vancouver:
House prices in Greater Vancouver, once one of the world’s hottest housing markets, fell 0.8% in August compared to July, the 13th month-to-month decline in a row, and were down 6.9% from the peak last July. This comes after the house price index had more than quadrupled over the 16-year period from January 2002 through July 2018. The index is now back where it had first been in September 2017:
The Teranet-National Bank House Price Index tracks prices of single-family houses though “sales pairs,” comparing the price of a house that sold in the current month to the price of the same house when it sold previously, often years earlier. This eliminates the issues of “mix” that median-price indices encounter and the issues of “big outliers” that average-price indices encounter.
A measure of house price inflation
The index tracks how many more Canadian dollars it takes to buy the same house over time. A price increase of the same house is a measure of how much purchasing power the Canadian dollar has lost with regards to houses. If the price of a house doubles over a number of years, it means the Canadian dollar has lost half its purchasing power with regards to houses. This makes this index (and similar indices, such as CoreLogic Case-Shiller Home Price Index for US housing markets) a measure of house price inflation.
But the index generates a softer and lagging image of the market compared to the official MLS House Price Index for Vancouver, which is based on a “typical” house with a “benchmark” price. The MLS HPI benchmark price for Greater Vancouver fell 10% in August from a year earlier and 13% from two years earlier.
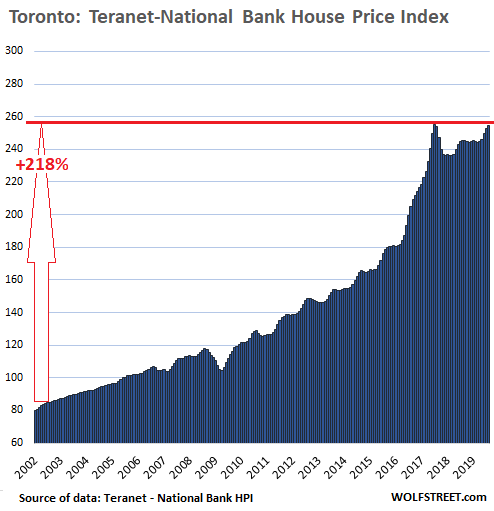
Toronto:
In the Greater Toronto Area (GTA), house prices rose 0.8% in August from July and were up 3.8% from August last year, but remain a tad below the peak in July 2017, according to the Teranet-National Bank House Price Index.
The Toronto index has more than tripled (+218%) since 2002, a huge increase in 17 years, but it pales against Vancouver’s 316% increase from 2002 through its peak in 2018. I put the charts here on the same scale as Vancouver’s chart to show how large the house price increases were in each metro compared to the other metros, and particularly compared to Vancouver. As we go down the list, the white space gets larger and larger:
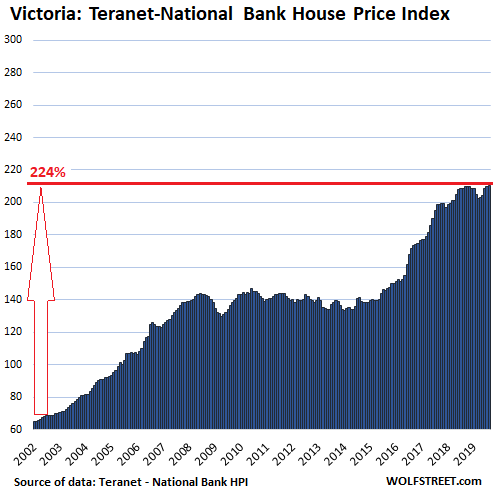
Victoria:
House prices in Victoria, which more than tripled since January 2002 (+224%), inched up 0.2% in August from July, and were up 0.7% year-over-year. The index eked out a new record, squeaking past the old peak set in September 2018 (chart is on the same scale as Vancouver’s):
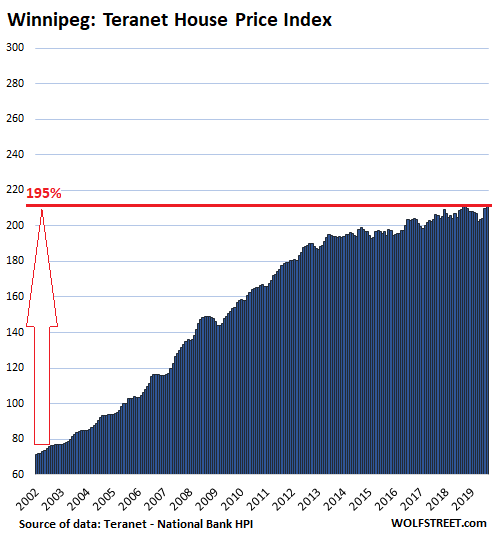
Winnipeg:
House prices in the Winnipeg metro rose 0.7% in August from July and 1.1% from August last year, but remained a smidgen below the peak in September 2018. The index had nearly tripled between 2002 and September 2014, and then stalled. The index is now 6.3% higher than it had been in September 2014:
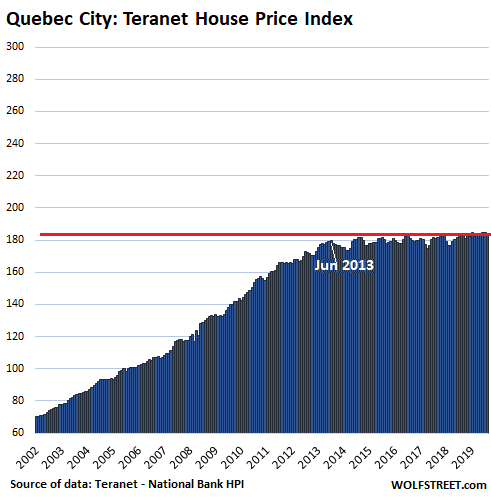
Quebec City:
The House Price Index for the Quebec City metro declined 0.4% in August from July and was flat compared to August last year, having been essentially flat since June 2013, a hangover from a 160% gain in the prior 12 years:
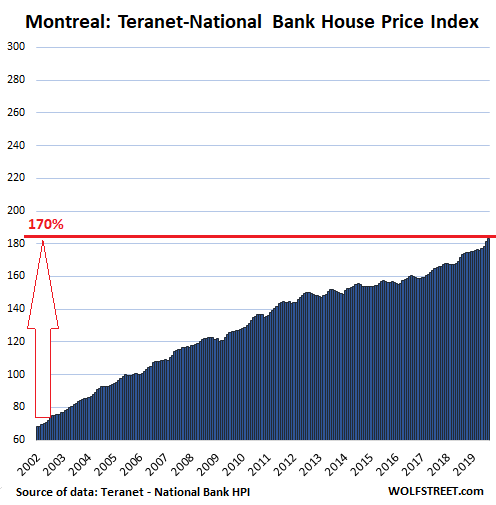
Montreal:
House prices in Montreal jumped 1.1% in August from July to a new record and were up 5.8% from August last year. The index has risen 170% since 2002 without even hesitating during the Financial Crisis:
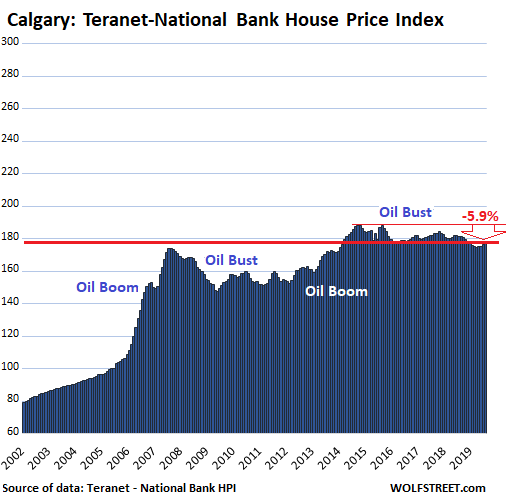
Oil Boom-and-Bust:
The housing markets in Calgary and Edmonton are dominated by oil booms and busts. In the two-year period during the oil boom before the Financial Crisis, house prices in Calgary soared by 78% and in Edmonton by 87%. But then came the oil bust, and these house price bubbles deflated – over the long term!
In Calgary, house prices rose 0.6% in August from July to their March 2014 level, but remain down 2.3% from a year ago, and 5.9% from the peak in October 2014:
In Edmonton, house prices inched down a smidgen in August from July and were down 3.1% from August last year and down 5.9% from the peak in October 2007:

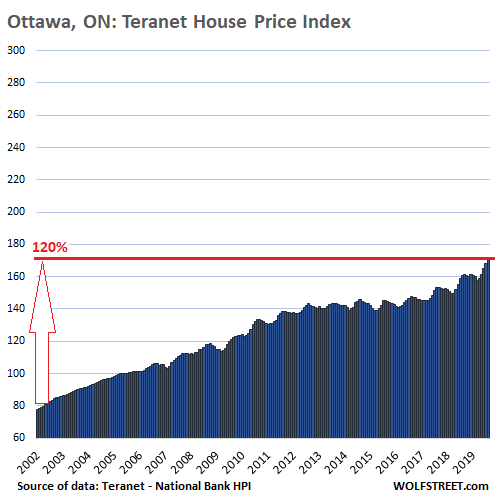
Ottawa:
House prices in Ottawa rose 1.7% in August from July to a new record, and are up 6.4% from August 2018. Since January 2002, the House Price Index has risen 120%, which is a big increase by any measure, but given the splendidness of the other housing bubbles in Canada, Ottawa ranks in last place on this list in terms of price gains:
“Wiring money overseas is not allowed for the purposes of purchasing real estate or insurance products,” explains a banker in China. Read… China Imposes New Capital Controls, Targets Foreign Real Estate Purchases, as Yuan Falls to 11-Year Low