by UPFINA
In the K-shaped recovery, the lower income class has far underperformed the middle and upper class. In the past expansion, much was made about the growing gap between the rich and the poor. Therefore, you might think recessions like this are normal. However, that’s an incorrect assumption. We also don’t think this type of recession is the future template for recessions. It will only be repeated if there is another pandemic.
The chart below shows how hard it has been for the working class. As you can see, 15% of renters say their household is not caught up on last month’s rent. Furthermore, 26% of households with children aren’t caught up on rent. We recently read something very profound for long term demographics. They said children are a luxury item. Obviously, we aren’t trying to equate kids with a fancy car.
A quarter of American tenant families with children ended 2020 behind on rent!@CenterOnBudget via @SoberLookhttps://t.co/3NndPyA2Oh pic.twitter.com/WK2kzSb9TY
— Adam Tooze (@adam_tooze) January 20, 2021
The point here is having kids is getting very expensive. 100 years ago, having kids helped the family on the farm. Now kids need to be babysat which is expensive. Furthermore, young adults are moving out later. No longer do parents need to take care of their kids from birth to 18. Now they need to take care of them until their lower 20s.
The two biggest expenses with having kids are education and healthcare. Kids are all going to pre-k and kindergarten and most young adults are trying to go to college. Healthcare is very expensive. COVID-19 made it even harder for lower income people with kids. Having kids is becoming something only upper middle class and rich people can afford to do.
Households Are In Good Shape
The previous section was bad news. Now let’s look at the good news. Consumers aren’t leveraged. They deleveraged in the last expansion. The 2000s credit bubble was the end of the long term debt cycle. The main reason consumers aren’t leveraged is housing. Interest rates are low, so debt servicing is cheap.
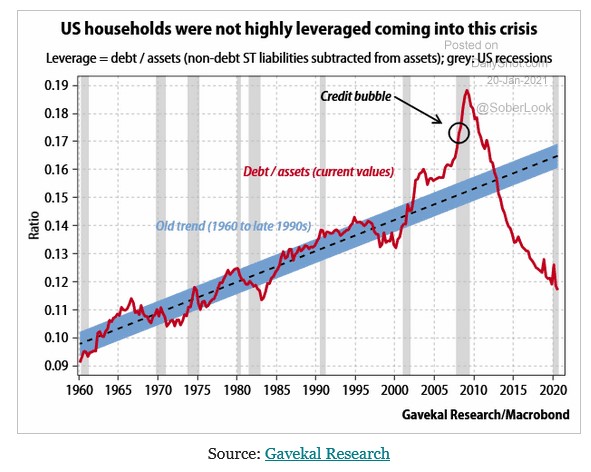
The one hedge we must make on this positivity is asset prices are very high. If the stock market falls 30%, housing prices fall, and interest rates spike, consumers won’t be in as good shape. Of course, the economy is great for consumers with assets and bad for those who don’t have any. It’s great for the top half of consumers who own stocks. The rising stock market hasn’t helped those who put all their hard earned money into their own small business only to watch it close.
Yield Curve Expected To Steepen
The yield curve is widely expected to steepen because we are about to have a cyclical upturn due to the reopening after COVID-19 and the Biden stimulus which is expected to be $1.9 trillion. As you can see from the chart below, expectations for the yield curve to steepen are at a record high going back to 2005. The three other times the curve was expected to steepen by most fund managers are highlighted. This makes it seem like this is a bad thing, but this time is different. Firstly, the curve was much steeper the other three times.
Steeper yield curve expectations at all-time high @SoberLook @ISABELNET_SA @BofAML pic.twitter.com/PLjLFZQoHp
— Rob Hager (@Rob_Hager) January 20, 2021
In October 2008, the difference between the 10 year yield and the 2 year yield was 2.45%. The curve was very steep, yet expectations for more steepening were high. They were very wrong for 2 months and then ended up being right. The economy ended up getting better after the Lehman moment. In August 2013, the difference between the 10 year yield and the 2 year yield was 2.39% which is also very steep. After a few months of modest steepening until December, the curve peaked. We’d say this was a very bad call.
The final example shown is November 2016 which was after Trump won. Investors thought he would bring about high growth and inflation. The reflation trade lasted a few months, but it ended up being a mistake, so it was given back. In November 2016, the difference between the 10 year yield and the 2 year yield was 1.26%. Expecting steepening was a terrible call because Trump didn’t catalyze inflation. The curve peaked at that moment and flattened until eventually inverting in 2019.
This time is different because the difference between the 10 year yield and the 2 year yield is only 96 basis points. Furthermore, we have an economy exiting a recession. In that manner it’s similar to October 2008 (except we are further from the bottom) and not like the others. The economy is like 2009, yet the curve doesn’t reflect the coming expansion.
Housing About To Ramp Further?
We’ve had a massive runup in housing which isn’t stopping. It should be helped by the improved economy as long as rates don’t spike. The current average 30 year fixed mortgage rate is 2.77%. We had one week were rates rose (2 weeks ago) following a long decline. We are pretty far from having rates hurt housing because they are still so low. We need the average 30 year mortgage rate to get back above 4% before there is a slowdown. MBA purchase applications were up 11% yearly 2 weeks ago and 11% in the week of January 15th.
Housing Inventory Weekly Update: Starting the Year at Record Lows https://t.co/JvJIyYLrHg pic.twitter.com/Vh0xncON2T
— Bill McBride (@calculatedrisk) January 18, 2021
Furthermore, as you can see from the chart above, home inventory is crashing which is good for prices and homebuilders. As of January 15th, the 7 day average of inventory was 389,000 which was down from 740,000 last year (47% decline). Inventory was 397,000 the prior week. The XHB homebuilder ETF is up 32.93% in the past 6 months. Now is not the time to buy housing stocks because the backdrop can’t get much better. Homebuilder sentiment is actually falling because it’s getting more expensive to build a house.
Conclusion
Renters with children are in a world of hurt as over a quarter are behind on rent. Consumers have low leverage, but of course consumers who don’t have assets aren’t in great shape. A record high net percentage of fund managers see the curve steepening. They probably are right. Housing inventories are extremely low. Now is a great time to be a homebuilder which is why now is not the time to invest in them (trade the cycle).