Candlestick charts, with their intricate designs resembling candles, have long been a favorite amongst traders. They originated in Japan over 300 years ago and provide a visual representation of the open, high, low, and close prices of a security for a specific period. While they offer a wealth of information and can form the basis of various trading strategies, they also come with potential pitfalls. Whether you’re a seasoned trader or just starting out, avoiding the following common mistakes can enhance your trading decisions when using a candlestick chart.
Ignoring the Context of the Market
One of the most common mistakes traders make is taking candlestick patterns at face value without considering the broader market context. A single candlestick pattern, even if it’s a strong bullish or bearish signal, doesn’t always guarantee a specific move in the market. It’s essential to look at the larger trends, market news, or other technical indicators that might influence price movement. For instance, a bullish pattern in a predominantly bearish market might not hold as much weight as it would in a neutral or bullish market.
Overreliance on Single Candlestick Patterns
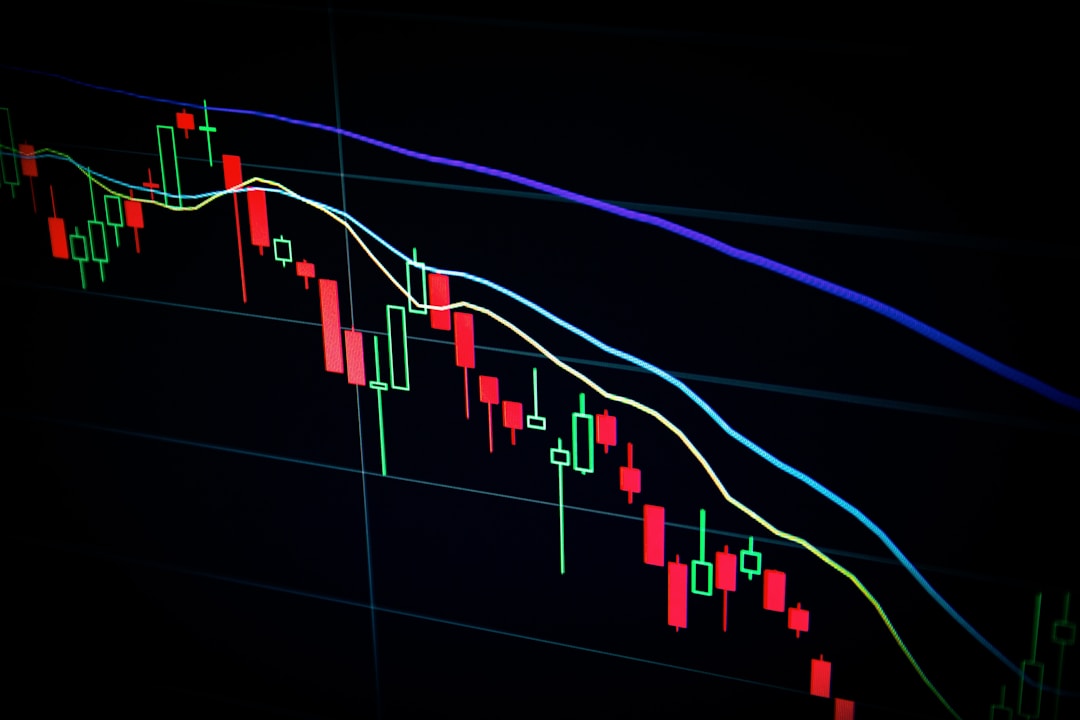
ALT: A visual example of a candlestick chart
While there are specific candlestick patterns known to signify potential market moves, relying solely on a single pattern can be misleading. It’s essential to use a combination of patterns to get a clearer picture. For instance, a single Doji candlestick may indicate uncertainty in the market, but its significance becomes much clearer when followed by a strong bullish or bearish candlestick. By waiting for additional confirmation from subsequent candlesticks or other technical indicators, traders can make more informed decisions.
Neglecting the Time Frame
Different time frames can paint very different pictures. A pattern on a daily chart may not have the same significance as on an hourly or weekly chart. Traders often make the mistake of identifying a pattern in a single time frame and applying that insight to another. This can lead to misguided trades. Always ensure that your analysis is consistent with your trading timeframe. If you’re making trades based on daily charts, avoid getting influenced by hourly fluctuations.
Letting Emotions Drive Decisions
Trading, by nature, can be an emotionally charged activity. When you see a series of green (bullish) candlesticks, it’s easy to get swept up in the excitement and make impulsive decisions. Conversely, a series of red (bearish) candlesticks might instill fear, leading to panic selling. It’s crucial to approach candlestick patterns with a disciplined mindset, focusing on the actual patterns and signals rather than allowing emotions to cloud judgment, and always practice data-driven decision-making.
Disregarding Volume
Volume plays a vital role in confirming candlestick patterns. High trading volumes can bolster the significance of a particular pattern, indicating strong buyer or seller interest. For instance, a bullish candlestick pattern accompanied by a surge in volume often reinforces the strength of a potential upward move. On the other hand, a bullish pattern with low volume may lack the momentum needed for a sustained uptrend. Traders who disregard volume often miss out on this critical piece of the puzzle.
Overcomplicating Analysis with Too Many Indicators
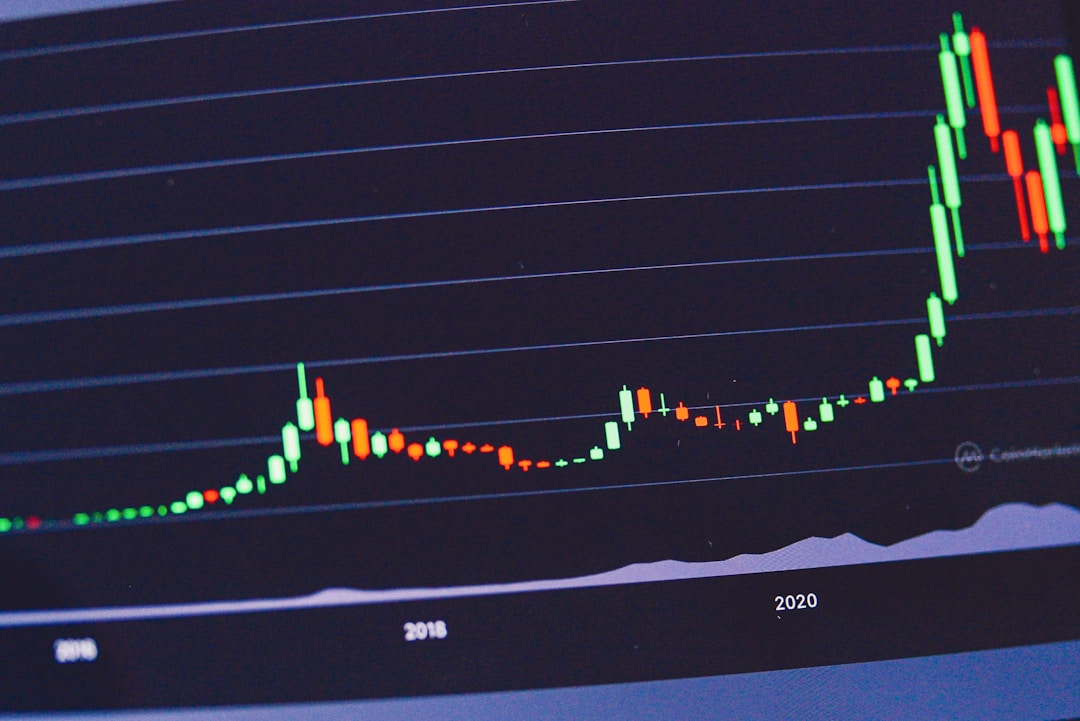
ALT: A candlestick chart representing market trends over time
While candlestick charts provide a wealth of information, integrating them with too many other technical indicators can lead to paralysis by analysis. When faced with conflicting signals from multiple indicators, traders might become indecisive or choose to ignore the insights provided by the candlestick patterns. It’s essential to find a balance. Instead of adding more and more indicators, traders should focus on mastering a few that complement candlestick analysis.
Failing to Set Stop-Loss Orders
Candlestick patterns, like all trading strategies, are not foolproof. There will be times when the market doesn’t move as anticipated. It’s crucial for traders to have a risk management strategy in place, which includes setting stop-loss orders. By determining in advance the maximum amount you’re willing to lose on a trade, you protect yourself from potentially catastrophic losses.
Mastery Through Continuous Learning
The intricate world of candlestick charts offers traders a deep well of insights, but it also presents a host of pitfalls for the unwary. Avoiding these common mistakes requires discipline, continuous learning, and a willingness to adapt to changing market conditions. Remember, the best traders are not those who never make mistakes, but those who learn from them. Embrace the lessons that candlestick charts offer, but always be prepared to refine your approach based on both successes and setbacks.
Disclaimer: This content does not necessarily represent the views of IWB.